Sep 08, 2025
Total carbohydrate content for coral samples
- 1Université Côte d'Azur


Protocol Citation: Keyla Plichon, Paola Furla 2025. Total carbohydrate content for coral samples. protocols.io https://dx.doi.org/10.17504/protocols.io.36wgq3j4xlk5/v1
License: This is an open access protocol distributed under the terms of the Creative Commons Attribution License, which permits unrestricted use, distribution, and reproduction in any medium, provided the original author and source are credited
Protocol status: Working
We use this protocol and it's working
Created: August 03, 2023
Last Modified: September 08, 2025
Protocol Integer ID: 85918
Keywords: Carbohydrate, coral, 96-well plate, cnidarians, total carbohydrate content for coral sample, carbohydrate analysis from coral species, cytosolic content extraction from coral sample, carbohydrate content, total carbohydrate content, carbohydrate analysis, coral sample, carbohydrate, cytosolic content extraction, cytosolic extraction, protein quantification, coral species, animal biomass, containing protein
Abstract
This protocol aims to quantify total carbohydrate content from a cytosolic extraction. It has been optimized for carbohydrate analysis from coral species. Here, the cytosolic extraction containing proteins and carbohydrates was extracted using the "Cytosolic content extraction from coral samples" method (doi). The quantification protocol is adapted from the phenol sulfuric method in a microplate format described by Masuko et al. (2005). The carbohydrate content is normalized by the animal biomass determined by protein quantification using the Bradford method.
Guidelines
The protocol can be completed within one hour.
Materials
Materials:
- Multi-channel pipette (50-300 μL)
- Clear 96-well plates with lid
Equipment:
- Fume hood
- Digital clock
- Heat plate large enough to hold a water bath
- Microplate absorbance reader
- Water bath
Compounds:
- D-glucose
- Phenol (100%)
- Sulfuric acid (100%)
- Milli-Q water
Safety warnings
This procedure uses hazardous chemicals.
- Read the SDS forms for each chemical in the procedure.
- Use Viton gloves (0.7 mm) throughout the procedure.
- Wear a lab coat and safety glasses throughout the procedure.
- Dispose of all chemical waste in appropriately labeled containers.
- Perform all steps in a fume hood.
Before start
Determine protein concentration for each sample.
Prepare stock solutions and set up
Prepare a stock of standard solution.
Prepare a standard stock solution of D-glucose with a final concentration of 2 g/L. Store it at 4°C in the dark. This standard solution should be prepared with the buffer solution used for tissue homogenate. Porro et al. (2023) describe the buffer used in this protocol.
Prepare a stock solution of phenol 5%.
Dilute the phenol solution in MilliQ water and store it at 4°C.
Prepare a stock of concentrated (100%) sulfuric acid.
Keep it at room temperature.
Set up the water bath.
Place the water bath under the fume hood and make sure the water is at 90°C. If you do not have a 96-well plate water bath, you can use a heating plate with a glass water container. Ensure enough water to heat the wells evenly without the plate sinking (see Figure 1.)
Figure 1. Water bath set up for 96-well plate.
Carbohydrate quantification in a 96-well plate
Carbohydrate standard for colorimetric detection.
Add 0, 1, 2, 4, 6, 8, 10, and 12 μL of the glucose stock solution directly into the 96-well plate. Bring the volume to 30 μL. Each well will, therefore, contain 0 (blank), 2, 4, 8, 12, 16, 20, and 24 μg.
Sample preparation.
Prepare a dilution of the homogenate in which the protein amount is known. This protein content will be used for normalization. For Pocillopora sp. and Porites sp. samples, the protein final concentration in each well was 0.1 μg/μL.
Add 30 μL of sample in each well in triplicates (one well will be used as blank for each sample). For the first assay, It may be necessary to prepare several dilutions of unknown samples to ensure that readings are within the standard range. Each plate can contain 24 samples.
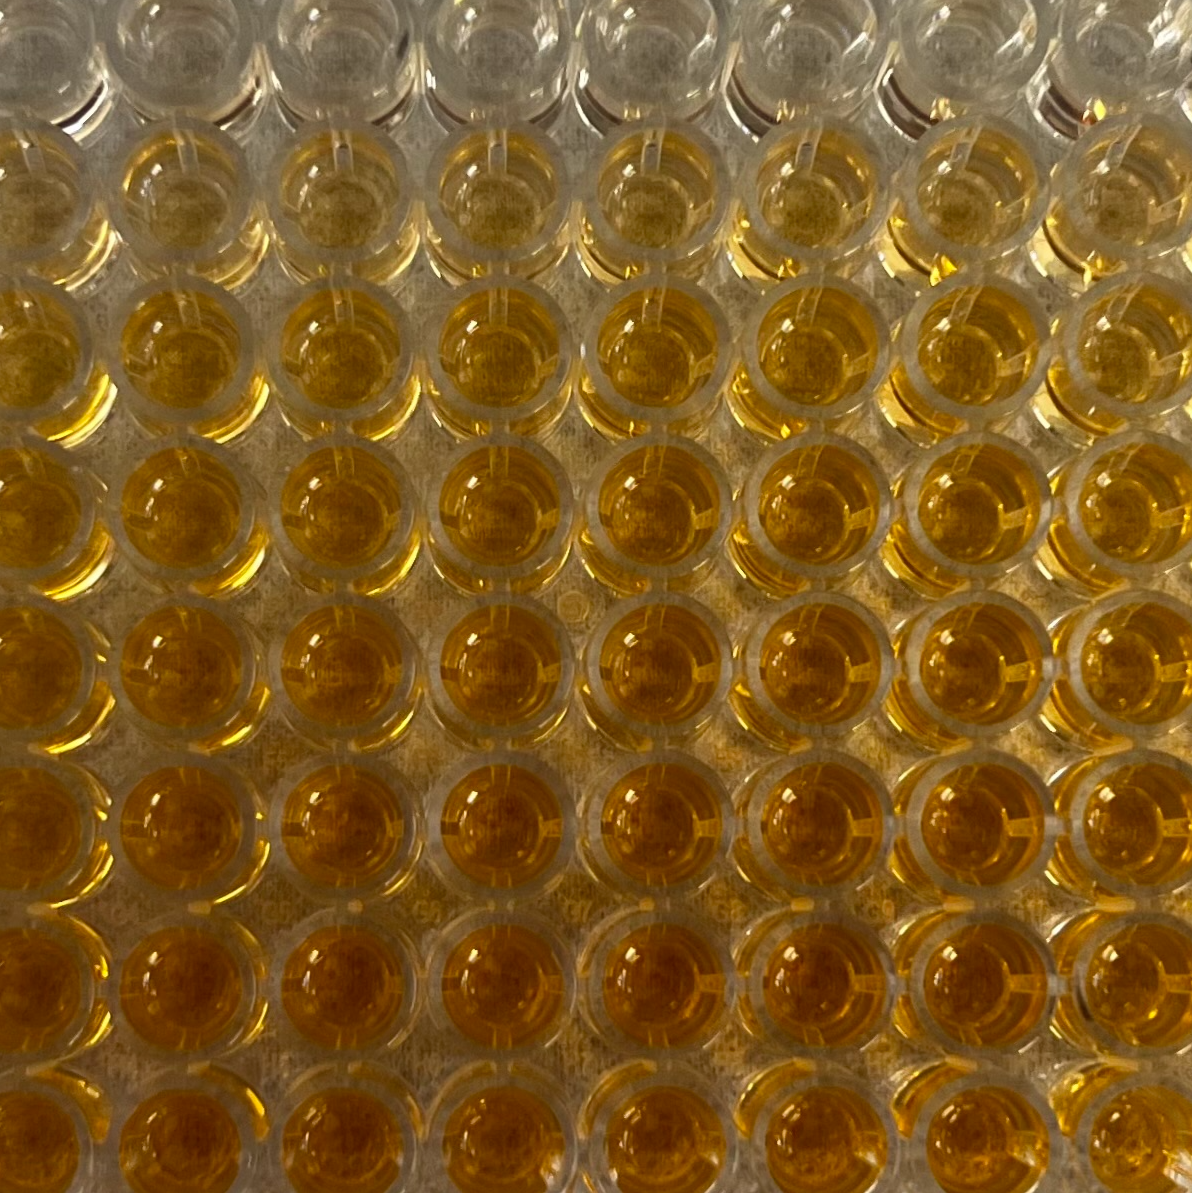
Figure 2. Disposition of the standard range and samples.
Add concentrated sulfuric acid.
Add 150 μL of the concentrated sulfuric acid to each well and mix by pipetting. Cover the plate and protect it from light. Incubate the reaction for 15 min in a water bath at 90°C.
Add the MilliQ (blanks) and reagent (phenol).
Remove the plate from the water bath and, at room temperature, add 30 μL of Milli-Q to the blank wells and 5% phenol solution to the duplicate wells, taking care to mix well. Incubate the plate for 5 min at room temperature.
Measure the absorbance.
Mix the well content before measuring absorbance at 490 nm. This step can be performed using a multi-pipette or a plate shaker. Read absorbance at 490 nm.
Calculations.
Correct the background by subtracting the blank values from all readings. Construct the standard curve by performing the mean of each concentration.
Use the standard curve equation to determine the carbohydrate content in 30 μL. Normalize by the amount of protein contained in the same volume.
Results are then expressed in μg of carbohydrate/μg of protein.
Protocol references