Apr 16, 2025
Tonic Stimulation of Dorsal Root Ganglion Results in Progressive Decline in Recruitment of Aα and Aβ-Fibers in Rats Protocol
- Jordyn E Ting1,
- Charli Ann Hooper2,
- Ashley N Dalrymple2,3,
- Douglas Weber2
- 1University of Pittsburgh;
- 2Carnegie Mellon University;
- 3University of Utah
- SPARCTech. support email: [email protected]


Protocol Citation: Jordyn E Ting, Charli Ann Hooper, Ashley N Dalrymple, Douglas Weber 2025. Tonic Stimulation of Dorsal Root Ganglion Results in Progressive Decline in Recruitment of Aα and Aβ-Fibers in Rats Protocol. protocols.io https://dx.doi.org/10.17504/protocols.io.261gee42yg47/v1
Manuscript citation:
Ting JE, Hooper CA, Dalrymple AN, Weber DJ. Tonic Stimulation of Dorsal Root
Ganglion Results in Progressive Decline in Recruitment of Aα/β-Fibers in Rats.
Neuromodulation. 2024 Dec;27(8):1347-1359. doi: 10.1016/j.neurom.2024.06.498.
License: This is an open access protocol distributed under the terms of the Creative Commons Attribution License, which permits unrestricted use, distribution, and reproduction in any medium, provided the original author and source are credited
Protocol status: Working
We use this protocol and it's working
Created: April 09, 2025
Last Modified: April 16, 2025
Protocol Integer ID: 126454
Keywords: Chronic Pain, Dorsal Root Ganglion, Electrical Stimulation, Neuromodulation, Rats, tonic stimulation of dorsal root ganglion result, tonic dorsal root ganglion stimulation, dorsal root ganglion result, tonic stimulation, relevant stimulation parameter, extended periods of stimulation, fiber recruitment due to each stimulus parameter, evoked response, fibers in rats protocol, ecap amplitude, fiber activation, stimulation, aβ, stimulus parameter, fiber recruitment, maintenance of action potential firing, time necessary for ecap, action potential firing
Funders Acknowledgements:
NIH/NINDS
Grant ID: RM1NS128775
Disclaimer
DISCLAIMER – FOR INFORMATIONAL PURPOSES ONLY; USE AT YOUR OWN RISK
The protocol content here is for informational purposes only and does not constitute legal, medical, clinical, or safety advice, or otherwise; content added to protocols.io is not peer reviewed and may not have undergone a formal approval of any kind. Information presented in this protocol should not substitute for independent professional judgment, advice, diagnosis, or treatment. Any action you take or refrain from taking using or relying upon the information presented here is strictly at your own risk. You agree that neither the Company nor any of the authors, contributors, administrators, or anyone else associated with protocols.io, can be held responsible for your use of the information contained in or linked to this protocol or any of our Sites/Apps and Services.
Abstract
This is a protocol for an experiment to characterize the recruitment and maintenance of action potential firing in Aα/β-fibers generated during tonic dorsal root ganglion stimulation (DRGS) applied over a range of clinically relevant stimulation parameters. This protocol will result in data describing the Aα/β-fiber activation thresholds and Aα/β-fiber recruitment due to each stimulus parameter. Data showing whether the evoked responses changed during extended periods of stimulation and to assess the time necessary for ECAP amplitude to fully recover due to tonic DRGS. As well as data measuring the ECAP latency and width at baseline and at the time point corresponding to a 50% reduction in ECAP amplitude.
Image Attribution
Ting JE, Hooper CA, Dalrymple AN, Weber DJ. Tonic Stimulation of Dorsal Root
Ganglion Results in Progressive Decline in Recruitment of Aα/β-Fibers in Rats.
Neuromodulation. 2024 Dec;27(8):1347-1359. doi: 10.1016/j.neurom.2024.06.498.
Materials
| A | B | C | D | E | F | G | H | |
| Electronic Equipment | Pre-surgery Tools | Surgical Tools | Surgical Accessories | Drugs | Misc. Hardware/Docs | Anesthesia/Vital Signs Monitoring | Implant Tools | |
| AM-Systems Stimulator Model 4100 | Eye lube | Disposable scalpel | Syringes (water, saline) | Isoflurane | Electrical tape | Anesthesia vaporizer | Surgical microscope | |
| Intan RHD Recording Controller | Surgical tape | Scissors - small pointy | Stainless steel bowl (trash) | Saline | Scissors | Temperature probe | Microrulers | |
| Intan RHD 16-Channel Bipolar-Input Recording Headstage | Clippers | Scissors - small round tip | Cotton balls | Drug Dosage sheet | Circulating water heater | |||
| Nerve cuffs | Vacuum | Forceps - small straight | Gauze, large | Notes doc | ||||
| DRG electrodes | Forceps - small curved | Gauze, small | Calipers | |||||
| EMG electrodes | Periosteal elevator | Absorbent triangle points | ||||||
| Cooner wire | Rongeurs (2 smallest sizes) | Suction beaker (enzyme) | ||||||
| retractors | Suction tube with beaker plug | |||||||
| Cauterizer | Suction large tube to vacuum | |||||||
| Piezo drill | Suction tip | |||||||
| Drill bit | Suction stylet | |||||||
| Microscissors | Bone wax | |||||||
| Cotton buds |
Troubleshooting
Experiment Model (Rat Anesthetization)
Anesthetized adult Sprague Dawley rats (11 female, nine male; >eight weeks old; 200–500 g; Charles River Laboratories, Wilmington, MA) with isoflurane (inhalation, 4%-5%).
Maintained anesthesia with isoflurane (inhalation, 1.5%–2.5%) for the duration of the experiment.
Applied lubricant to the eyes and administered glycopyrrolate (intramuscular, 2.5 mL/kg) to reduce salivary, tracheobronchial, and pharyngeal secretions.
Continuously monitored vital signs including respiratory rate, core temperature, and blink and withdrawal reflexes throughout the experiment.
After the experiment, euthanized the animal with isoflurane overdose (inhalation, 5%).
Implant DRG and Nerve Cuff Electrodes
Shaved the lumbar region of the back and dorsal aspect of the hindlimb.
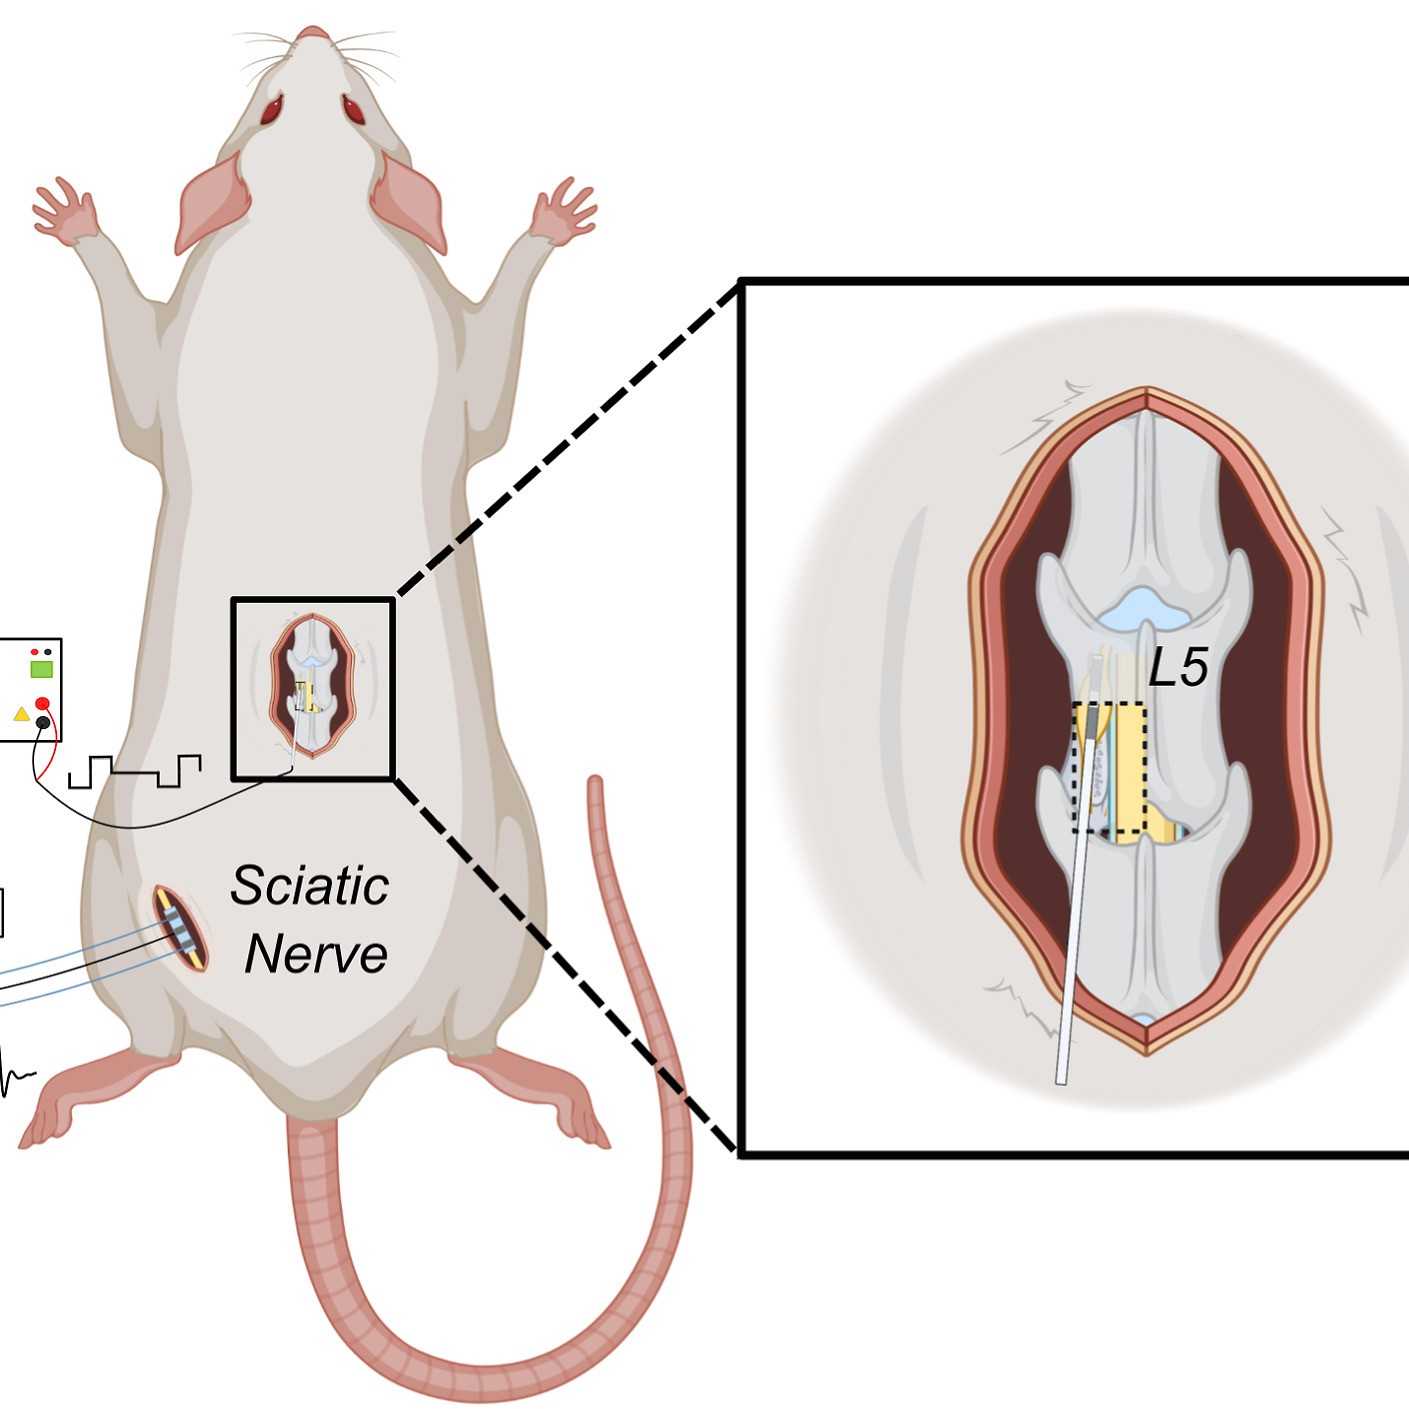
Made an incision over the L4-L6 lamina and performed a partial laminectomy of the L5 vertebrae to expose the caudal portion of the L5 dorsal root ganglion (DRG).
Placed a bipolar, cylindrical electrode lead (platinum/iridium, contact length = 0.76 mm, interelectrode spacing = 0.5 mm; Abbott Neuromodulation, Plano, TX) over the dorsal aspect of the L5 DRG to deliver DRG stimulation.
Exposed the sciatic nerve ipsilateral to the target DRG and bluntly dissected the nerve from the surrounding muscle and connective tissue.
Placed a tripolar cuff electrode (1.5-mm diameter; Micro-Leads, Somerville, MA) around the sciatic nerve to measure evoked responses.
Inserted a pair of intramuscular needle electrodes into the triceps surae muscle group for bipolar electromyography, and a ground electrode either between the skin and fascia of the hindlimb or near the base of the tail.
After the experiment, measured the distance along the sciatic nerve from the stimulation site on the DRG to the recording site on the sciatic nerve to determine the conduction velocity of evoked responses in each animal.
Data Acquisition and Stimulation
NOTE: Performed all processing and analysis of the data in MATLAB (MathWorks, Natick, MA).
Delivered bipolar electrical stimulation to the L5 DRG using symmetric, biphasic waveforms of varying current-amplitude, pulse width, and frequency, depending on the experimental paradigm (see Experimental Paradigms section below).
Recorded evoked compound action potentials (ECAPs) from the sciatic nerve cuff electrodes while DRG stimulation was delivered.
Electroneurogram (ENG) signals were sampled from the sciatic nerve cuff electrode at 30 kHz and digitized using an Intan headstage and recording system (RHD2216, Intan Technologies, Los Angeles, CA).
Used conduction velocities to determine which afferent fiber types were contributing to each identified ECAP (Aα/β: >14 m/s; Aδ: 2.2–8 m/s; C: <1.2 m/s).
Calculated conduction velocities of the ECAPs using the distance between the DRG stimulation and cuff electrodes and the latency of the first peak of the ECAP.
Bandpass-filtered (300–3000 Hz) the ENG data before further processing to identify ECAPs.
Blanked stimulation artifacts over a time window ranging from 100 μs to 1 ms in duration, depending on the pulse width applied in a particular trial.
Experimental Paradigms
Recruitment:
Varied stimulus pulse width and frequency around the typical clinical parameters (300 μs, 20 Hz)1,2, to test the effects of varying each parameter on Aα/β-fiber activation thresholds (AT), or the charge required to elicit a detectable ECAP, and Aα/β-fiber recruitment.
Delivered DRGS at 20 Hz with pulse widths of 50, 150, 300, and 500 μs when testing for pulse width effects.
Applied DRGS at frequencies of 5, 20, 50, and 100 Hz using 300-μs pulses when testing for frequency effects.
Randomized the amplitude of DRG stimulation current-pulses to generate recruitment curves of ECAPs recorded from the sciatic nerve for each trial.
Applied 50 to 300 pulses (3–15 seconds) to the DRG with a 5- to 10-second interval between different amplitude levels for each amplitude level.
Measured motor thresholds (MTs) for each pulse width and frequency parameter combination.
NOTE: An MT is the charge level at which a muscle contraction was visible in the hindlimb.
Used a bootstrapping method, described in detail in prior studies3,4, to detect Aα/β-fiber ECAPs.
Bootstrapping Method Summary:
a. Stimulus-triggered averages (STA) were generated from random samples of the ENG recorded during 80% of the total stimulus repetitions (50–300).
b. Depending on DRG stimulation frequency, we produced 50 random STA samples for trials with 5-Hz DRG stimulation and 100 samples for trials with 20-, 50-, or 100-Hz DRGS for each trial.
c. Calculated the root mean square (RMS) of each averaged ENG signal using a 100-μs sliding window with 33-μs overlap with the previous window.
d. Defined the ECAP detection threshold as one standard deviation greater than the upper bound of the 99% confidence interval (CI) of the baseline RMS amplitude during a 1-millisecond period before each stimulus.
e. Successfully identified an ECAP in a given trial if the same 100-μs RMS window contained suprathreshold values for 95% of the random samples.
f. Validated automatically detected ECAPs by visual inspection.
g. Defined the Aα/β-fiber AT for a given recruitment trial as the lowest DRG stimulation charge level (current-amplitude × pulse width; nC) with a detected ECAP.
To compare initial ECAP amplitudes elicited at AT, averaged the amplitudes from each tested frequency (5, 10, 20, 50, and 100 Hz) to yield one value per frequency for each animal.
Normalized the mean amplitudes from each animal to the mean value at 20 Hz for the corresponding animal.
Performed one-way analysis of variance (ANOVA) and Tukey–Kramer post-hoc tests with α-level of 0.05 to assess differences in ATs due to DRG stimulation frequency or pulse width.
Performed paired, two-tailed t-tests with α-level of 0.05 to compare Aα/β-fiber AT and MT in corresponding trials.
Performed one-way ANOVA and Tukey–Kramer post-hoc tests with α-level of 0.05 to evaluate differences in initial ECAP amplitudes due to DRG stimulation frequency.
Tonic DRG Stimulation:
Delivered DRG stimulation continuously in 180-second intervals at pulse frequencies of 5, 10, 20, 50, and 100 Hz to study whether evoked responses changed during extended periods of stimulation and to assess the time necessary for ECAP amplitude to fully recover.
Determined the recovery time through turning off DRG stimulation for an interval of varying duration (30–120 seconds; recovery phase) before turning it on for an additional 30 seconds to measure ECAP amplitudes after the recovery phase.
Used 300-μs pulses and a current amplitude equaling 120% of AT, which was determined for each tested frequency before conducting tonic DRG stimulation experiments.
Measured ECAP amplitudes throughout each 180-s bout of tonic DRG stimulation.
Identified ECAPs occurring during a time window corresponding to the latency of Aα/β-fiber responses:
a. Calculated the peak-to-peak amplitude of each ECAP elicited during 1-second windows immediately after the onset of DRG stimulation (ie, 0–1 seconds after onset for 0 second time point) and at 1-second intervals throughout each 180-second trial.
Normalized each ECAP measurement by subtracting the peak-to-peak of the baseline ENG activity (measured in a 0.5-millisecond window occurring before each DRG stimulation pulse) from the peak-to-peak of the ECAP to account for any changes in the baseline noise level during trials.
Calculated the mean and standard deviation of the ECAP amplitudes in each 1-second window and used these values for further processing.
Averaged across amplitudes in 1-second windows in all trials, regardless of DRG stimulation frequency, meaning that DRG stimulation at 5 Hz resulted in five amplitude measurements per 1-second interval, whereas DRGS at 100 Hz yielded 100 measurements.
Fit the ECAP amplitude (AECAP) measurements obtained from each trial with exponential decay functions (ie, AECAP = b1eb2t + b3, where t is time during DRG stimulation) and obtained the reported decay time constants (ie, b2) from each fit.
Excluded fits that were not statistically significant (p > 0.05) and fits in which the value of the decay constant fell outside of three standard deviations of the mean decay constant for that particular frequency group.
Pooled the time constants across all trials and animals to yield a single mean value and standard deviation for each tested frequency.
Calculated the final ECAP amplitude for each trial as the mean of the last 15 seconds of amplitude measurements from the exponential fit.
Compared the peak-to-peak amplitude measured in the first 1-second interval of DRG stimulation after the variable-length recovery phase with the ECAP amplitude measured immediately after onset of the initial tonic DRG stimulation period (ie, baseline level) to measure the rate and extent of ECAP recovery.
Performed linear regression to model the recovery rate of ECAPs during the 180-second interval following cessation of tonic DRG stimulation for each frequency group:
a. A linear model of the form y = mx + b was used, where x is the time in seconds since cessation of DRG stimulation and y is the amplitude of the ECAP, measured as a percentage of the initial ECAP amplitude.
b. The slope (m) in this model represents the recovery rate, and the intercept (b) represents the ECAP amplitude at the end of the 180-second period of tonic DRG stimulation.
Considered the ECAP amplitude to be recovered fully when its difference from the baseline amplitude was not statistically significant.
Performed one-way ANOVA and Tukey–Kramer post-hoc tests with α-level of 0.05 to evaluate differences in decay constants, final ECAP amplitudes, and recovered ECAP amplitudes after 120 seconds due to DRG stimulation frequency.
Mechanisms of ECAP Suppression:
Measured ECAP latency and width at baseline and at the time point corresponding to a 50% reduction in ECAP amplitude to explore potential mechanisms underlying the effects of tonic DRG stimulation on Aα/β-fiber recruitment.
Obtained ECAP latency and width measurements from the average ECAP trace in 1-second windows during DRG stimulation.
Defined the ECAP latency as the time from stimulus onset to the time of the positive peak of the ECAP identified within the Aα/β-CV window.
Identified both peaks of the ECAP and defined the start of the negative peak as the midpoint between the positive and negative peak amplitudes to measure ECAP width.
Determined the halfway point of the negative peak between the start of the peak and full negative peak amplitude and used this amplitude to calculate the width.
Identified the point at which the ENG signal crossed this half-amplitude point (intersect function, MATLAB) and defined the ECAP width as the time difference between these two intersection points.
ECAP peaks and intersection points used to calculate width were plotted and visually inspected.
Traces that did not contain identifiable ENG intersection points were excluded from further analysis. Specifically, trials were excluded if fewer than ten ECAP measurements could be obtained from a 15-second window around the time point corresponding to a 50% reduction in amplitude.
Performed paired, two-tailed t-tests with α-level of 0.05 to compare ECAP latencies or ECAP widths at baseline and at 50% of ECAP amplitude.
Performed experiments to determine whether fibers contributing to the ECAP were undergoing changes in their excitation thresholds during tonic DRG stimulation.
Delivered a preconditioning period (3 seconds) of DRG stimulation, followed immediately (∼1 second) by tonic DRG stimulation for 180 seconds to evaluate ECAPs before and after tonic DRG stimulation.
Applied DRG stimulation during a postconditioning period (3 seconds) ∼1 second after turning tonic DRG stimulation off.
ECAPs detected during the preconditioning period served as a baseline for comparing responses detected during the postconditioning period.
Delivered tonic DRGS at a range of frequencies (5, 20, 50, and 100 Hz) using 300-μs pulses and current amplitudes equaling 130% of AT.
Delivered pre- and postconditioning periods of DRG stimulation with the same frequency and pulse width as tonic DRG stimulation; however, the current amplitudes for the pre- and postconditioning periods were incremented by 1 μA in each subsequent trial to determine the current level at which pre- and postconditioning ECAPs were approximately equal in size.
Generated an STA to yield a mean ECAP waveform for each of the 3-second pre- and postconditioning phases of DRG stimulation to compare ECAP amplitude in the Threshold Change Experiments.
Calculated the peak-to-peak amplitude from the mean ECAPs for the pre- and postconditioning phases of each trial.
Used these amplitudes to calculate the ratio of postconditioning ECAP amplitude to preconditioning ECAP amplitude as a percentage. If this value was ≥90%, the pre- and postconditioning ECAP amplitudes were considered to be approximately equal.
Performed a one-way ANOVA and Tukey–Kramer post-hoc test with α-level of 0.05 to evaluate differences in the current level required to generate an average ECAP in the postconditioning phase that was at least 90% of initial ECAP amplitude due to DRG stimulation frequency.
Performed a paired t-test of both the ECAP latencies and ECAP widths, comparing the values measured during the pre- and postconditioning phases; values obtained across all frequencies were grouped.
Protocol references
1: Deer, Timothy R. et al. Dorsal root ganglion
stimulation yielded higher treatment success rate for complex regional pain
syndrome and causalgia at 3 and 12 months: a randomized comparative trial. PAIN
158(4):p 669-681, April 2017. | DOI: 10.1097/j.pain.0000000000000814
2: Kent AR, Min X, Hogan QH, Kramer JM. Mechanisms of Dorsal
Root Ganglion Stimulation in Pain Suppression: A Computational Modeling
Analysis. Neuromodulation. 2018 Apr;21(3):234-246. doi: 10.1111/ner.12754.
3: Ameya C Nanivadekar et al 2020 J.
Neural Eng. 17 016011. DOI: 10.1088/1741-2552/ab4a24
4: Ayers CA, Fisher LE, Gaunt RA, Weber DJ. Microstimulation of the lumbar DRG
recruits primary afferent neurons in localized regions of lower limb. J
Neurophysiol. 2016 Jul 1;116(1):51-60. doi: 10.1152/jn.00961.2015.
Acknowledgements
The authors thank Sharon John, Kestrel Merritt, and Sebastian Correa for their assistance during surgical procedures; Angela Malaney and the rodent facility staff at Carnegie Mellon University for their animal care services; and Ameya Nanivadekar from Abbott Neuromodulation for donating the electrodes.