May 25, 2026
Version 1
SOP for methods paper GUI V.1
- Christopher Smith1,
- Ruban Rex Peter Durairaj1,
- Emma L. Randall1,
- Alys N. Aston1,
- Laura Heraty1,
- Waheba Elsayed1,
- Alvaro Murillo1,
- Vincent Dion*1
- 1UK Dementia Research Institute
- Ruban Rex Peter Durairaj: *: correspondence to [email protected]


External link: https://zenodo.org/records/18863035
Protocol Citation: Christopher Smith, Ruban Rex Peter Durairaj, Emma L. Randall, Alys N. Aston, Laura Heraty, Waheba Elsayed, Alvaro Murillo, Vincent Dion* 2026. SOP for methods paper GUI. protocols.io https://dx.doi.org/10.17504/protocols.io.5qpvoej1bl4o/v1
License: This is an open access protocol distributed under the terms of the Creative Commons Attribution License, which permits unrestricted use, distribution, and reproduction in any medium, provided the original author and source are credited
Protocol status: Working
We use this protocol and it's working
Created: May 23, 2026
Last Modified: May 25, 2026
Protocol Integer ID: 317788
Keywords: Expanded CAG/CTG repeat disorders, long-read sequencing, mismatch repair, repeat instability, somatic mosaicism., quantifying somatic instability, based instability assay, instability assay, expanded repeat instability, clone assay, ongoing somatic instability, comprehensive view of repeat instability, mechanism of repeat instability, disease progression, expansion of short tandem repeat, somatic instability, changes in repeat size distribution, short tandem repeat, repeat size distribution, repeat size, vivo dataset, read sequencing, sequencing data, reads with each repeat size, gene knockout method, existing assay, measures such as instability indice, bottleneck in the repeat, gene knockout, instability rate, average size of the change, other repeat, instability frequency, changes in repeat array length, instability indice
Funders Acknowledgements:
Pfizer
Abstract
A novel analysis pipeline and experimental design for measuring expanded repeat instability.
The expansion of short tandem repeats is a feature of over 60 different human diseases. Ongoing somatic instability throughout a patient’s lifetime can influence disease progression and has emerged as a therapeutic target. Understanding its mechanism is essential for the identification of both drug targets and therapeutic interventions. A major obstacle towards this translational goal has been to measure changes in repeat size distribution given that these are complex datasets. To address this, here we provide a new analysis method, and accompanying software, that generates delta plots, extracts the instability frequency from targeted long-read sequencing data, the bias towards expansion or contraction, and the average size of the changes. It further provides statistical analysis for comparison between treatments. We show its applicability to non-dividing cells, and in vivo datasets. Moreover, we have developed a streamlined experimental design for dividing cells, Single Clone-based Instability Assay (SCIA), that saves weeks in assessing the effect of a gene knockout on repeat instability and is ideal for an initial screen. We have validated the approach using FAN1, PMS1, and MLH1 knockouts. Using SCIA, we find that although FAN1 knockout clones showed increased frequency of expansions, the size of the expansions were smaller. This highlights the wealth of information that can be extracted and the potential for novel insights into the mechanism of repeat instability.
The Authors present an integrated framework, called SCIA, for quantifying somatic instability of expanded CAG/CTG repeats using single-clone assays coupled with long-read sequencing. We provide a GUI (Mac OS recommended) that, in conjunction with long-read sequencing (and, optionally a gene knockout method available as a separate protocol) addresses a well-recognized bottleneck in the repeat-disease field, as existing assays are often time-consuming, low-throughput, and limited in resolution.
This SOP details a computational tool that distinguishes between instability rate and changes in repeat array length, offering a more comprehensive view of repeat instability than currently used measures such as instability indices [2].
The Gui can be used to run Repeat Detector(RD [I]) on targeted sequencing (e.g. amplicon) data containing CAG/CTG repeats (other repeats could be included *). Input is fasta files which must be stored locally. The output is histogram frequency data for number of reads with each repeat size, which can be plotted or further quantified and analysed with instability indices and a new tool we call delta-plots.
Guidelines
GUI for Windows and macOS
**Windows**
1. Download Docker Desktop for Windows**, install it, and ensure it is running.
2. Download the Repeat Detector Docker image from Zenodo**.
3. Download GUI Zenodo**.
4. Copy the GUI files and run them locally from your computer rather than from networked folders.
5. Locate, unzip GUI_publish_v2_Mar2026_Win.exe and right-click and Run as administrator**.
6. If Windows shows a security warning, click More info**, then click Run anyway**.
7. When the app opens, browse and locate the downloaded repeat-detector.tar file
8. Next, browse and locate the FASTA file. If you have FASTQ/FASTQ.gz files, use seqkit fq2fa to convert them to FASTA format.
9. Choose output base folder.
10. Next, select D0 or control fasta files, make sure the name has the string (D0, Day0, Ctrl, control, ctl, this is needed for automatic folder organisation of folders)
11. Next choose appropriate profile- restrictive or permissive
12. Choose appropriate Instability mode and max repeat size and threshold for filtering.
13. Click Run RD Program**
14. It may take a minute or two for the Docker image to load.
15. In delta plot tab, choose appropriate control and treated folders for Dataset 1 and Dataset 2.
16. Adjust plot parameters as per the experiment.
17. Choose the result folder, this is where all the results will be stored.
18. Click Run Delta + KS Test button to process. (based on screen size, this button might be hidden, to fix this, adjust the scale: SystemeDisplaye Scale to 100%)
**macOS**
1. Download Docker Desktop for macOS from Docker Desktop for Mac**, install it, and ensure it is running.
2. Download the Repeat Detector Docker image from Zenodo**.
3. Download GUI Zenodo**.
4. Copy the GUI files and run them locally from your computer rather than from networked folders.
5. Locate, unzip and double-click GUI_publish_v1_Feb2026_mac**.
6. If macOS shows a security warning, go to System Preferences e Security Privacy, and allow the app to run by clicking Open anyway**
7. It might take a few minutes to open, if it does not open with first double clicking, repeat the clicking and wait
8. When the app opens, browse and locate the downloaded repeat-detector.tar file
9. Next, browse and locate the FASTA file. If you have FASTQ/FASTQ.gz files, use seqkit fq2fa to convert them to FASTA format.
10. Choose output base folder.
11. Next, select D0 or control fasta files, make sure the name has the string (D0, Day0, Ctrl, control, ctl, this is needed for automatic folder organisation of folders)
12. Next choose appropriate profile- restrictive or permissive
13. Choose appropriate Instability mode and max repeat size and threshold for filtering. *explain why we need threshold, what the default is
14. Click Run RD Program**
15. It may take a minute or two for the Docker image to load.
16. In delta plot tab, choose appropriate control and treated folders for Dataset 1 and Dataset 2.
17. Adjust plot parameters as per the experiment.
18. Choose the result folder, this is where all the results will be stored.
19. Click Run Delta + KS Test button to process.
Materials
Windows 11/ Mac OS
Docker Desktop for Windows or MacOS
Gui (a containerised Python app) from Zenodo (see Guidelines for useage)**
FASTA files containing repeat sequence data (eg PACBIO HIFI reads)
**software for the analysis of changes in repeat size distributions.
To promote the use of delta plots and of the analysis pipeline, we have developed software with a graphical user interface (GUI). It requires a docker container, the docker object .tar file, and the FASTA files containing the circular consensus sequences (CCSs) or reads as input. The software runs Repeat Detector [1], which determines the size of the repeat for each CCS and outputs text files and plots the histograms of frequencies against repeat sizes. There is an option to calculate the instability index. The second module calculates delta plots from the normalised histogram data. Two independent datasets, each containing both control and treatment histograms, can be loaded simultaneously. It determines the area under the curve, the average size of the expansions and of the contractions, and the bias ratio. There is an option to perform a KS test to compare two genotypes. Of note, the software is not limited to SMRT sequencing data and can be used with an Illumina MiSeq or, with some modifications to the Repeat Detector profile, Oxford Nanopore Technologies. One limitation of the current version is that some experimental designs, for example when we compared experimental replicates, each with their own controls and treated samples (e.g., comparing two mouse hemispheres, one treated, the other not), the averaging of the replicates is not supported by the software and needs to be done by hand. The software still extracts all the information for the individual experimental replicates. The software is freely available via https://github.com/DionLab/SCIA, with a version controlled found at
Software
DeltaPlot Gui
NAME
Mac
OS
Smith, Durairaj
DEVELOPER
REPOSITORY
SOURCE LINK
.
Analysis software
The GUI was developed using Python (version 3.13.5) together with wxPython library (version 4.2.3). Pandas (version 2.2.3) and NumPy (version 2.1.3) were used for data handling. Seaborn (version 0.13.2), with matplotlib (version 3.10.8) were used for visualization. RD is containerized within Docker (version 28.4.0) with .tar extension. We tested the application on macOS (Darwin Kernel Version 24.6.0), and it is made to run on both Intel and latest Apple Silicon chip architectures. There is a singularity containerized object available to run on a HPC setting. Note that some of the scripts used here were coded with the help of AI.
The workflow of the software (version 2.0) is found in Supplementary Figure 1, and a working video example is also available (Supplementary Video 1). A detailed instruction is available on GitHub (https://github.com/DionLab/SCIA). The prerequisites are that the Docker desktop app is installed locally and running. The repeat-detector.tar file must be downloaded and present locally. The input for running RD and instability index is a FASTA file. FASTQ files were converted to FASTA using SeqKit. The user interface consists of two tabs. One tab is dedicated to Repeat Detector and instability indices. The user needs to specify which FASTA file is that of the control conditions. Both permissive and restrictive Repeat Detector profiles can be run, and a variety of output options are available to visualize repeat size distributions. The second tab uses the histogram outputs of Repeat Detector as input and generates the delta plots and runs the statistical analyses, including a KS test when two delta plots are compared. It returns a statistics summary containing the instability frequency, the average size of expansions and contractions, and the bias ratio.
Troubleshooting
Problem
Docker
Solution
Installing Docker on Windows can be a challenge. Administrator rights are required. Please see the Docker website for installation details. Current tested version is 4.74.0 on Mac OS
Problem
RD tarball
Solution
Do not unzip/ unpack the tarball. Just copy it to the desktop as provided.
Problem
When I run the RD tab of the GUI I get cryptic error messages about Docker or the RD tar file.
Solution
Almost always this is caused by having the FASTA files nested too deeply in a file hierarchy. The ‘closer’ the files are to the Desktop, the smoother the experience of using the GUI will be. No subfolders! Similarly, don’t create subfolders within the histogram Control and Treatment folders.
Problem
What are restrictive and permissive settings in the RD tab?
Solution
Restrictive and permissive modes control how Repeat Detector counts repeat sequences when analysing reads. Restrictive mode uses strict matching and stops counting when it encounters an unexpected base, insertion, or interruption, making it useful for measuring the length of uninterrupted repeat tracts. Permissive mode is more tolerant and continues counting through small differences or interruptions, helping identify repeat structures that contain interruptions or sequence variation. Comparing results from both modes can help detect interrupted alleles, as a larger difference between permissive and restrictive repeat counts may indicate the presence of interruptions within the repeat sequence. For a full explanation see [1]
Problem
What is “thresholding” in the RD tab?
Solution
There is no clear boundary between signal and noise [2]. Thresholding is a noise-filtering step that removes low-confidence peaks before quantifying CAG repeat expansions/contractions. The solution implemented here [2] is a relative peak height threshold method:
1. Find the highest peak (mode).
2. Compute 5% of that peak height (user defines).
3. Draw a threshold line at that value.
4. Discard every peak below that threshold.
5. Only keep peaks above threshold for instability calculations.
Problem
I used Repeat Detector to create histograms. I haven’t used the delta tab of the GUI. Now I want to use the delta tab to make delta-plots by browsing to my old histograms. BUT I AM GETTING UNEXPECTED RESULTS THAT SUGGEST THE DAY 0 (OR CONTROL) MODE IS BEING CHOSEN INCORRECTLY. The software appears to be USING JUST THE LARGEST PEAK (AT SAY 19cag) PEAK. WHY?
Solution
The delta plotter requires the user to identify the control/OR DAY 0 histograms. These files are then appended with the name “day0” or similar metadata which the analysis function looks for to correctly calculate delta . If you haven’t done this in the GUI delta tab, YOU NEED TO MANUALLY RENAME YOUR APPROPRIATE HISTOGRAMS WITH “DAY0” IN THE SAMPLE NAME. Note, THE GUI NOW HAS THE OPTION (ITEM 6 ON FIG 2) TO DESIGNATE A HISTOGRAM AS DAY 0/ CONTROL
Problem
My histogram file isn’t being processed. why?
Solution
Did you rename the file? File names must NOT have spaces in them. Always use underscores (_) . Histograms must end rest.histogram
If you modify histograms(eg in excel) then saving the histogram file will append *.txt
(MYFILE.rest.histogram.txt)
If the extension .txt is added to a modified histogram file, it will no longer be recognized by the GUI. In windows-11 it can be removed by right clickinge properties e view tab e show file name extensions then remove the .txt
In other versions of windows excel can save as “all files” and the .txt extension shouldn’t be appended.
Problem
Why do my stats change (slightly) for each new test?
Solution
The reason appears to be that each analysis is likely to change the bin offset value range.
So for a wild-type cell line sample run singly, the offset might run -100 to +100. When we compare to a test line (a knockout line say) that second data set may have a bin offset of -105 to +105. Now, the wildtype has its trailing data appended with padding zeros, for the range -101 to -105 and +101 to +105. Then the stats (AUC) are calculated.
Repeating the analysis with that same wild-type cell-line and a different treatment (a knock-in line this time) the bin offsets will likely change slightly (say -107 to +107) with a subsequent additional tail-end padding of missing data with zeros and a recalculation of the statistics, now showing slight variation for the wild-type cell line data between both analyses.
This can be mitigated by selecting appropriate y-axis values in the deltaplot tab (box 7 in figure 2) eg. +107 to -107
Problem
I ran a single dataset. Why can’t I see a KS p value? Two datasets are required to generate a two-sample KS test file.
Solution
Two datasets are required to generate a two-sample KS test file.
Problem
How do I report the expansion and contraction statistics (mean +/- SD) generated?
Solution
We suggest 3 significant figures +/- 2 significant figures so 5.65 +/- 2.7 or 46.7 +/- 10 or 78.9 +/- 3.8.
Safety warnings
no warnings
Before start
We recommend **macOS**
1. Download Docker Desktop for macOS from Docker Desktop for Mac**, install it, and ensure it is running.
2. Download the Repeat Detector Docker image from Zenodo**.
3. Download GUI Zenodo**.
4. Copy the GUI files and run them locally from your computer rather than from networked folders.
5. Locate, unzip and double-click GUI_publish_v1_Feb2026_mac**.
6. If macOS shows a security warning, go to System Preferences e Security Privacy, and allow the app to run by clicking Open anyway**
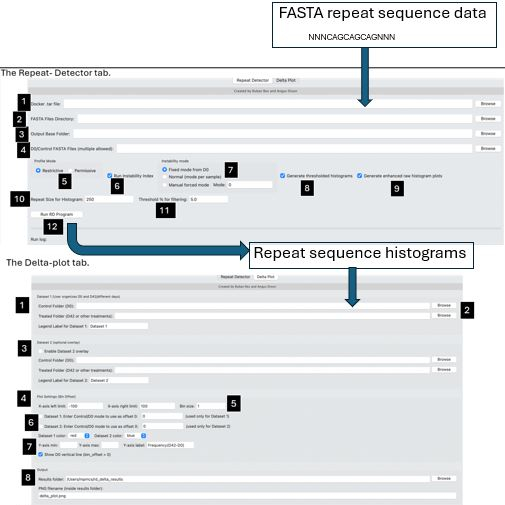
see Guidelines for overview. refer to protocol image/visual abstract image for notes here
1.Browse to folder or location containing Docker tar file (recommend Desktop).
2.Browse to folder containing of FASTA files
3.Recommend a new folder is created for each experiments histogram files and identified
here,
4.Within the folder containing FASTA files, identify the day0/control FASTA file(s)
5.Select Restrictive (default) or Permissive to disallow/allow interruptions in repeat
tract see FAQ and [1]
6.Select box to include calculation of Instability Indices (see [2])
7.Define modal repeat used to calculate instability indices (default uses mode of day 0 sample(s) see doi: 10.1186/1752-0509-4-29 but user can select a peak or define the mode of a desired peak
8.create copies of the histogram files that have been trimmed to exclude extraneous
peaks other than those user define or modal. These are required for instability
index calculation.
9.create copies of the histogram files that have been trimmed to exclude extraneous
peaks other than those user define or modal. These are required for instability
index calculation
10.Define maximum expected size of repeat tract in units of discrete repeats (eg
CAG trinucleotodes),
11. Define noise threshold repeat below this in sequencing data will be considered background noise and ignored see doi: 10.1186/1752-0509-4-29)
12.Run Repeat Detector analysis and create histograms from FASTA sequences. These will form the input to tab 2: the Delta Plot analysis
DELTA TAB
Move to the (optional) Delta-plot tab to gain further insight into your repeat histogram data
see Guidelines for overview. refer to visual abstract image for notes here
1.Dataset 1 entry: user browses to folder containing control and treatment histograms. In
doing so, the control histogram folder names are appended with ”day0” metadata
label.
2.Browse to histogram files (*.histogram) representing binned repeat counts for
condition 1 (eg control at day 0) and condition 2 (eg treatment at day 42)
3 Optionally,add in a second dataset of histograms allowing the user to overlay two
delta-plots and run Kolmogorov-Smirnov
(KS) test.
4.Settings for x axis (representing an index from the mode of day 0 where the range shows increases or decreases in units of repeat motif )
5.Bin size- provides a way to plot averages of histogram bins (a default bin of 1 is
required for KS test. A bin of 5 smooths plot complexity for visual appeal
only)
6.The package requires histogram filenames
of the day0/control condition to be annotated so a correct starting peak can be
identified. This can be done manually by renaming files, it can be done during
dataset browsing (see 1 above), and the software will take the modal peak, or
it can be done using these option buttons to force the starting mode to be
taken as a user defined modal peak.
7.Select plot aesthetics and (optionally)
define maximum and minimum y axis offset values (the weighted index representoing
change in repeat units from defined starting point). Leave blank if unsure.
8.Browse to output folder (strongly recommend a new folder for each analysis). Name deltaplot
here.
9.click this button to start analysis or abort settings
10.plot preview window. Now move to output folder, examine Deltaplot(s), statistics and Delta data
DATA TYPE A EXAMPLE: default approach : replicates derived from a common population. Each experiment comprises 8 to 12 replicate clones (requires dividing cells) with a shared condition (grown for x days, treated with a compound, a gene knockout etc) derived from a shared common bulk population d
DATA TYPE B EXAMPLE three replicates comprising: three independent day zeros and EACH WITH 3 clones at day 42.
DATA TYPE C: . No day 0 required. Run the GUI using your treatment sample (eg: Cas9+guide) vs your control (eg: Cas9 only). This will give you your first data set. Run a similar approach with another dataset (eg: Cas9+guide v2 where v2 can be a different Cas or using a different guide) vs the same control as for dataset 1 (Cas9 only). This will be your data set 2.
Protocol references
1. Taylor AS, Barros D, Gobet N, Schuepbach T, McAllister B, Aeschbach L, Randall EL, Trofimenco E, Heuchan ER, Barszcz P, Ciosi M, Morgan J, Hafford-Tear NJ, Davidson AE, Massey TH, Monckton DG, Jones L, Network RIOTEHD, Xenarios I, Dion V. Repeat Detector: versatile sizing of expanded tandem repeats and identification of interrupted alleles from targeted DNA sequencing. NAR Genom Bioinform. 2022 Dec 5;4(4):lqac089. doi: 10.1093/nargab/lqac089. PMID: 36478959; PMCID: PMC9719798.
2. Lee JM, Zhang J, Su AI, Walker JR, Wiltshire T, Kang K, Dragileva E, Gillis T, Lopez ET, Boily MJ, Cyr M, Kohane I, Gusella JF, MacDonald ME, Wheeler VC. A novel approach to investigate tissue-specific trinucleotide repeat instability. BMC Syst Biol. 2010 Mar 19;4:29. doi: 10.1186/1752-0509-4-29. PMID: 20302627; PMCID: PMC2856555.