Jan 15, 2024
Real time-quaking induced conversion assay (RT-QUIC)
- 1Duke University
- West lab protocols


External link: https://doi.org/10.1126/sciadv.adq3539
Protocol Citation: andrew.west , arpine.sokratian 2024. Real time-quaking induced conversion assay (RT-QUIC). protocols.io https://dx.doi.org/10.17504/protocols.io.6qpvr67kpvmk/v1
Manuscript citation:
Sokratian A, Zhou Y, Tatli M, Burbidge KJ, Xu E, Viverette E, Donzelli S, Duda AM, Yuan Y, Li H, Strader S, Patel N, Shiell L, Malankhanova T, Chen O, Mazzulli JR, Perera L, Stahlberg H, Borgnia M, Bartesaghi A, Lashuel HA, West AB Mouse α-synuclein fibrils are structurally and functionally distinct from human fibrils associated with Lewy body diseases. Science Advances 10(44). doi: 10.1126/sciadv.adq3539
License: This is an open access protocol distributed under the terms of the Creative Commons Attribution License, which permits unrestricted use, distribution, and reproduction in any medium, provided the original author and source are credited
Protocol status: Working
We use this protocol and it's working
Created: May 23, 2022
Last Modified: May 31, 2024
Protocol Integer ID: 63010
Keywords: ASAPCRN, synuclein, induced conversion assay, conversion assay, amplification assay, assay
Funders Acknowledgements:
Aligning Science Across Parkinson’s
Grant ID: ASAP-020527
Abstract
Seeded-amplification assay (SAA) method for the detection of pathology-associated aggregation-templating competent forms of alpha-synuclein and other interacting factors.
Attachments

Protocol materials
TweezersTEDPELLACatalog #534
Corning® 384-well Black/Clear Bottom Low Flange Ultra-Low Attachment Microplate Bulk PackedCorningCatalog #4588
BioSpec Products 2.3 mm Zirconia/Silica Beads 1 lb bottleFisher ScientificCatalog #NC0451999
1X PBS (Phosphate-buffered saline )
Amicon Ultra-0.5 Centrifugal Filter Unit 24 packMerck Millipore (EMD Millipore)Catalog #UFC505024
250g Guanidine hydrochlorideG-BiosciencesCatalog #BC85
Thioflavin TMerck MilliporeSigma (Sigma-Aldrich)Catalog #T3516
PCR Plate Heat Seal foil piercableBio-Rad LaboratoriesCatalog #1814040
Plate preparation
30s
Thaw down a-syn monomer and sonicated fibril aliquots On ice , do not generate bubbles by pipetting
Measure monomer concentration via Nanodrop
Add 3 µL of 10x diluted aliquot in PBS onto nanodrop piedestal;
Parameters: other proteins; coefficient extinction: 5.98; MW: 14.4 kDA
Perform two measurements and confirm <10% standard error between two measurements
If necessary, prepare 20X and 30X dilutions to confirm findings.
Equipment
NanoDrop™ One/OneC Microvolume UV-Vis Spectrophotometer
NAME
UV-Vis Spectrophotometer
TYPE
Thermo Scientific
BRAND
ND-ONE-W
SKU
Calculate the volume of monomer need following: 0.3 mg/mL monomer in a reaction mix X 30 µL per well
30 ul (reaction volume) * 3 (replicates) * ____ (different conditions) = _____ul;
Dilute the monomer preparation with 1X PBS (Phosphate-buffered saline ) to 2.5 mg/mL in order to filter the protein preparation for a high efficiency
Use Amicon Ultra-0.5 Centrifugal Filter Unit 24 packMerck Millipore (EMD Millipore)Catalog #UFC505024 to filter out possible aggregates or HMW contaminates
Meantime measure concentration of sonicated fibrils: prepare serial dilutions: 2x; 4x; 8x in3 Mass Percent Guanidine HCL, volume: 10 µL 250g Guanidine hydrochlorideG-BiosciencesCatalog #BC85
Add 3 µL onto nanodrop piedestal;
Parameters: other proteins; coefficient extinction: 5.98; MW: 14.4 kDA
Blank against 3 Mass Percent Guanidine HCL;
Perform two measurements for each dilution and confirm <10% standard error between two measurements
Equipment
NanoDrop™ One UV-Vis Spectrophotometer
NAME
spectrophotometer
TYPE
Thermo Scientific
BRAND
ND-ONE-W
SKU
LINK
Sample Volume (Metric): Minimum 1µL; Spectral Bandwidth: ≤1.8 nm (FWHM at Hg 254 nm); System Requirements: Windows™ 8.1 and 10, 64 bit; Voltage: 12 V (DC); Wavelength Range: 190–850 nm
SPECIFICATIONS
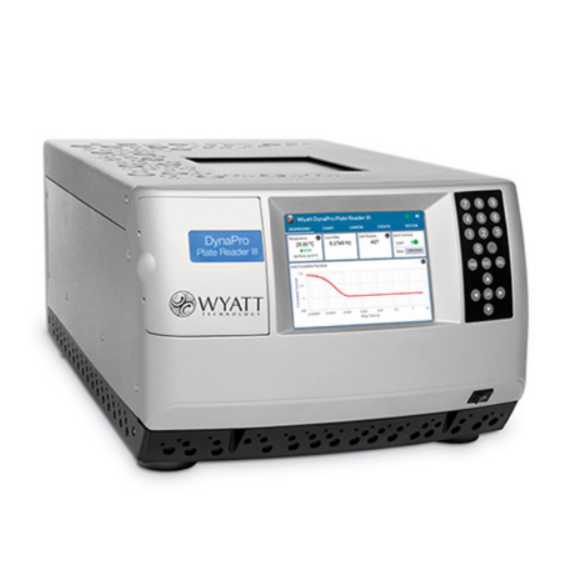
Measure DLS data for sonicated fibrils
Place single zirconia bead into each well of the Corning® 384-well Black/Clear Bottom Low Flange Ultra-Low Attachment Microplate Bulk PackedCorningCatalog #4588
BioSpec Products 2.3 mm Zirconia/Silica Beads 1 lb bottleFisher ScientificCatalog #NC0451999 TweezersTEDPELLACatalog #534
Prepare serial dilutions of sonicated fibrils:
Prepare solution: 1 mg/mL measured PFFs (20 µL volume);
1. 10 ug/ml: 10 ul PFFs + 990 ul of PBS;
2. 1000 ng/ml: 10 ul PFFs + 90 ul of PBS;
3. 100 ng/ml: 10 ul PFFs + 90 ul of PBS;
4. 10 ng/ml: 10 ul PFFs + 90 ul of PBS;
5. 1 ng/ml: 10 ul PFFs + 90 ul of PBS;
6. 100 pg/ml: 10 ul PFFs + 90 ul of PBS;
7. 10 pg/ml: 10 ul PFFs + 90 ul of PBS;
8. 1 pg/ml: 10 ul PFFs + 90 ul of PBS;
9. 100 fg/ml: 10 ul PFFs + 90 ul of PBS;
10. 10 fg/ml: 10 ul PFFs + 90 ul of PBS;
Prepare reaction mix:
0.3 mg/mL monomer in a reaction mix + 10 micromolar (µM) Thioflavin TMerck MilliporeSigma (Sigma-Aldrich)Catalog #T3516 in PBS (account for 10% volume to add) = __ 30 µL reaction * triplicates * sample number (include standard curve of PFFs serial dilutions, 10 reactions in triplicates)
[total volume * 0.1% = total volume - (total volume * 0.1%)] - [volume of filtered monomer at __ mg/mL after filter] - [ThT volume] = __ volume of PBS
Prepare a standard curve using PFFs dilutions from
1. 100 ng/ml: 10 ul of #2 (from step 8) + 90 ul of reaction mix;
2. 10 ng/ml: 10 ul of #3 (from step 8) + 90 ul of reaction mix;
3. 1 ng/ml: 10 ul of #4 (from step 8) + 90 ul of reaction mix;
4. 100 pg/ml: 10 ul of #5 (from step 8)+ 90 ul of reaction mix;
5. 10 pg/ml: 10 ul of #6 (from step 8) + 90 ul of reaction mix;
6. 1 pg/ml: 10 ul of #7 (from step 8) + 90 ul of reaction mix;
7. 100 fg/ml: 10 ul of #8 (from step 8) + 90 ul of reaction mix;
8. 10 fg/ml: 10 ul of #9 (from step 8) + 90 ul of reaction mix;
9. 1 fg/ml: 10 ul of #10 (from step 8) + 90 ul of reaction mix;
10. PBS: 10 ul of PBS + 90 ul of reaction mix;
Transfer reaction to the plate: start filling the plate with a standard curve samples (seal the portion with a sealing foil)
PCR Plate Heat Seal foil piercableBio-Rad LaboratoriesCatalog #1814040
Proceed the experimental samples and cover the whole plate with a sealing foil. Spin down the plate 500 x g
for 00:00:30
Equipment
Eppendorf™ 022620572
NAME
Microcentrifuges with a plate rotor
TYPE
Eppendorf
BRAND
13-690-003
SKU
Example of the plate layout:
30s
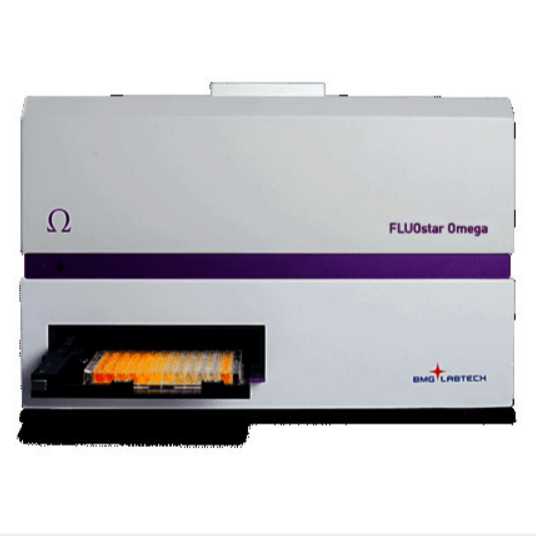
Set up the program on a plate reader
Equipment
Omega - RT-QuIC / PRION Version - Fluorescence Base
NAME
BMG Fluostar plate reader
TYPE
BMG
BRAND
0415-102P
SKU
Finish the experiment once standard curve reached the plateau
EXAMPLE: Plateau is reached at7 hours.
Data analysis
Convert collected data from plate reader into .xlsx type
EXAMPLE:
The main advantage of qQuiC analysis is capability to calculate exact amount of fibril forming units in pathological samples relatively to an appropriate standard curve. The approach of calculation FFUs consists of using standard curve with a range of serial dilutions of evaluated ssFibrils spiked in original matrix of the sample. Obtained ThT FL units for each time point and dilution are needed to define an appropriate threshold value needed to define CT values. To find a threshold value we built a program that can find an increase in the rates of changes greater than X present for fluorescence values in each replicate. The program looks at three points at a time and compares the rate of change from the first point to the second point against the second point to the third point. Once it finds the point where the rate of change increases by X present from one jump to the next the program stores that value to calculate the threshold value for each sample at X percent as the cutoff difference in the rates of change. The code loops through all of the replicates >30 times to check every percent threshold for X from 10% to 30% and returns the threshold value that yield the highest R-squared in a standard curve that is made from the mean CT values for each replicate. When threshold value is found CT value for each dilution can be determined as a time when ThT fluorescence reaches to a threshold. If R-square is higher than 0.8 than efficacy of the reaction is enough to be able to calculate FFUs. To define FFUs of experimental samples we applied an extracted equation from linear regression curve. Code for a program https://github.com/west-lab/FibrilOptimization/blob/master/FibrilPaperCode_main.py
This step is required to QC the reaction by evaluating the standard curve and finding the Ct values for experimental conditions
Use mean half-time of the reaction by analyzing the Ct values of the standard curve
Extract RFU values for each condition
EXAMPLE:
Use the extracted data to generate a plot or a group analysis via GraphPad