Aug 13, 2025
QuPath Stain Quantification of Whole Tissue by Percent Area
- Patricia Lumanto1,2,
- Sonya Macparland1,2,
- Diana Nakib1,2
- 1University of Toronto;
- 2University Health Network


Protocol Citation: Patricia Lumanto, Sonya Macparland, Diana Nakib 2025. QuPath Stain Quantification of Whole Tissue by Percent Area. protocols.io https://dx.doi.org/10.17504/protocols.io.6qpvrw64olmk/v1
License: This is an open access protocol distributed under the terms of the Creative Commons Attribution License, which permits unrestricted use, distribution, and reproduction in any medium, provided the original author and source are credited
Protocol status: Working
We use this protocol and it's working
Created: July 29, 2025
Last Modified: August 13, 2025
Protocol Integer ID: 223610
Keywords: Liver, QuPath, Quantification, Stain Density, Stain Intensity, quantification by area, tissue sample, digital pathology, immunohistochemistry , source imaging software, positive cell detection, qupath stain quantification of whole tissue, qupath stain quantification, whole tissue stain quantification, reproducible protocol for whole tissue stain quantification, percentage area of positive stain, digital pathology software, source digital pathology software, qupath, whole tissue section, histological stain, whole tissue, positive stain, collagen deposition, fibrosi, percentage area, percent area, markers such as tunel, percent area this protocol, tissue
Abstract
This protocol utilizes QuPath, an open-source digital pathology software, to quantify histological stains (nuclear and non-nuclear(nuclear and non-nu) based on the percentage area of positive stain across whole tissue sections. It enables the assessment of non-nuclei stains, including commonly used markers such as TUNEL, to detect apoptosis, and Masson's Trichrome, to detect fibrosis and collagen deposition. This approach provides a reproducible protocol for whole tissue stain quantification.
Materials
QuPath v.0.4.3
Initial Project Setup
Click on File: Project to start a project.
Note: a project must be created in order for a thresholder to be saved, as well as for annotations and measurements to be exported. This protocol will not work without the creation of a project.
Tip: prepare an empty folder with an appropriate folder name prior to starting the project.
Import the desired image by clicking on File: Open.
Note: scanned image files (e.g. .czi, .tiff) may take up quite a bit of space on your internal memory, make sure sufficient space is available on your local drive.
Select the appropriate image type for the file opened (e.g. Brightfield H&E, Brightfield H-DAB).
Note: For Masson's Trichrome, select Brightfield H&E. For TUNEL, select Brightfield H-DAB.
Create classes by right clicking on the Annotation Classes: Add/Remove: Add class list on the Annotation tab.
Tip: Name the desired classes based on the quantification of interest and select a color corresponding to that stain by double clicking the created class (e.g. Collagen as teal, non-Collagen as purple; TUNEL Live as purple, TUNEL Dead as brown)
Class list showing the right click menu to add or remove classes.
Selecting the Region of Interest by Simple Tissue Detection
Select Analyze: Deprecated: Simple tissue detection to select the region of interest.
Note: There are 4 main settings to be adjusted, each of which can be increased or decreased depending on the specific tissue stain intensity and architecture.
- Threshold: directly related to the tissue intensity, a higher threshold corresponds to a more sensitive tissue detection (typically ~ 170 to 210 for liver samples)
- Requested pixel size: relates to how smooth each boundary line will be (typically set to 2-3 pixels)
- Minimum area: adjust to enable more precise acquisition of small tissue fragments, a lower value will be required to capture smaller fragments, otherwise a higher value can also be used to exclude specific tissue fragments
- Max fill area: adjust to exclude tissue vasculature, tears, and gaps, a lower value will provide more specific exclusion
Tip: start with a higher requested pixel size (~10-20) when initially adjusting each setting, as run times take longer as the requested pixel size gets smaller.
Simple tissue detection pop-up menu showing the different adjustable settings.
Click Run to start simple tissue detection.
- Keep adjusting each setting until the tissue of interest is properly selected.
- Change Requested pixel size to 2 or 3 once other settings are optimized.
Example of optimal tissue selection based on tissue stain intensity and morphology.
Quantification of Stain of Interest by Percent Area of Total Tissue
Click on Classify: Pixel classification: Create thresholder to create pixel classifications by percent area.
Pixel classification pop-up menu showing the adjustable parameters for quantification.
Adjust each setting to allow for a more refined separation of color corresponding to each stain.
Note: adjust the overlay opacity while adjusting to allow for better visualization while manipulating the threshold.
Tip: start on a moderate or low resolution while adjusting the threshold, once the desired separation is achieved, change the resolution to full (0.50μm/px).
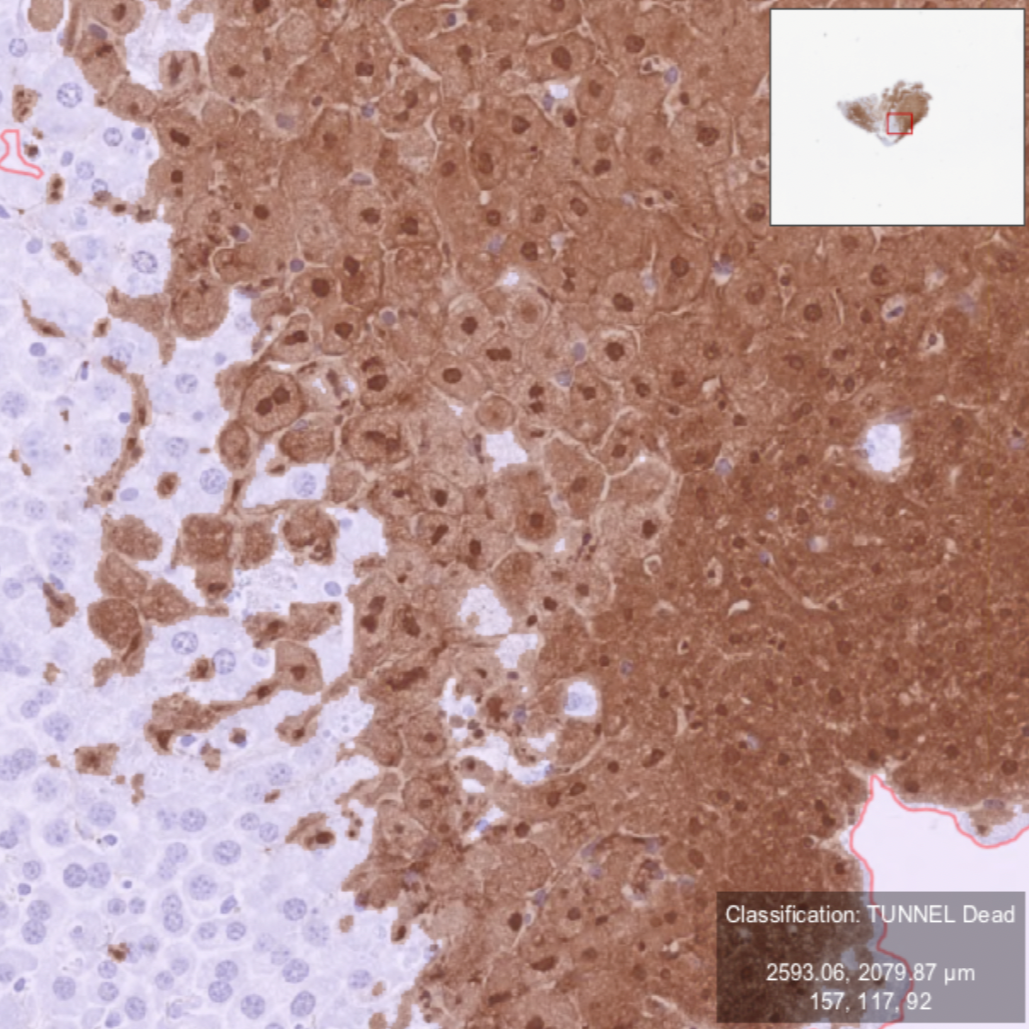
Example of an optimal color separation in TUNEL staining showing dead cells in brown and live cells in purple.
Example of an optimal color separation in Masson's Trichrome staining showing collagen deposition in teal and non-collagen regions in purple/red.
Save the classifier using the stain name (e.g. Masson's Trichrome, TUNEL).
Select the region of interest (previously selected in Section 2 using the simple tissue detection tool).
Classify the tissue by clicking Classify: Pixel classification: Load pixel classifier.
Apply pixel classification to the tissue by selecting the previously named pixel classifier on the Choose model drop down menu and clicking Measure.
Note: a pixel classifier pop-up menu will show up, select objects as best suited (e.g. Current selection, Full image, All annotations).
Results and File Export
Tissue quantification by stain will be listed on the bottom left of the screen on the Measurements tab.
Final quantification results by percent area of a tissue stained with TUNEL.
Final quantification results by percent area of a tissue stained with Masson's Trichrome.
Click on Measurements: Export measurements to export data into a .tsv file.
- Click on export annotations.
- Click on browse to select a name and file path for the export.
Note: the generated .tsv file can be opened on spreadsheet programs such as Microsoft Excel and copied to data analyzing softwares.