Dec 08, 2025
Protocol to conduct an EEG on decapod crustacean species
- Rodrigo Lorenzo1,
- Luca Pettinau2,
- Hans van de Vis2,
- Henny Heinbert2,
- Albin Gräns3,
- Guiomar Rotllant1
- 1Institut de Ciències del Mar, Spanish National Research Council (CSIC), Barcelona, Spain.;
- 2Wageningen Livestock Research, De Elst 1, 6708 WD, Wageningen, The Netherlands.;
- 3Department of Animal Environment and Health, Swedish University of Agricultural Sciences, Skara, Sweden.


Protocol Citation: Rodrigo Lorenzo, Luca Pettinau, Hans van de Vis, Henny Heinbert, Albin Gräns, Guiomar Rotllant 2025. Protocol to conduct an EEG on decapod crustacean species. protocols.io https://dx.doi.org/10.17504/protocols.io.eq2ly4mdqlx9/v1
License: This is an open access protocol distributed under the terms of the Creative Commons Attribution License, which permits unrestricted use, distribution, and reproduction in any medium, provided the original author and source are credited
Protocol status: In development
We are still developing and optimizing this protocol
Created: December 08, 2025
Last Modified: December 08, 2025
Protocol Integer ID: 234471
Keywords: EEG, Lobster, shrimp, crab, unconsciousness, eeg on decapod crustacean species, crustacean brain, application to other decapod crustacean species, decapod crustacean species, other decapod crustacean species, eeg, different consciousness state, ecophysiological difference, penaeus vannamei, different species, monitoring the electrical activity, electrical activity
Funders Acknowledgements:
European Union’s Horizon Europe Project (EUPAHW)
Grant ID: 101136346
Disclaimer
The authors acknowledge the anatomical and ontogenetic differences from a vertebrate brain; however, the terms 'brain' and 'brain activity' are used in accordance with the guidelines of Richter et al. (2010) to ensure comparability across invertebrate taxa.
Abstract
This protocol attempts to standardize the monitoring the electrical activity of the crustacean brain to distinguish different consciousness states. Although this protocol has been trialled in different species (eg. Homarus americanus, Cancer pagurus, Penaeus vannamei), its application to other decapod crustacean species needs to be tested, given their anatomical and ecophysiological differences.
Image Attribution
Fig. 1. Experimental set up example. In our case the Quad- or Octal-Bio Amp is plugged into the PowerLab and a laptop is used to visualize the recordings. The cables are 1.5 m long and the electrodes 0.4 mm wide.
Fig. 2. Schematic representation of electrodes placement flanking the brain and ground electrode on the tail (B) of Homarus americanus, with dorsal view of the approximate location of the brain (B).
Fig. 3. EEG
distinctive brainwaves that correspond with different states of consciousness.
Guidelines
The electroencephalography (EEG) is an extracellular recording of the electrical activity of the brain, detected between pairs or by single electrodes. This protocol aims to maximize the precision of neurophysiological measurement by restraining animals, acknowledging the stress this may cause. It is a working protocol that has been tested and trialled, but it may be modified if the authors deem it necessary. It is very important to have studied previously the anatomy of the species to know the exact place were to insert the electrodes and the exact depth; take in account that brain1 is very small and less than a millimetre makes a large difference in the measurements. This protocol could be applied to study unconsciousness (Runcinque et al., 2023) after the use of an anaesthetic (Bowman et al., 2019) or electrical stunning (Kells et al., 2023; Neil et al., 2024).
Materials
-Amplifier (in our case we use Quad and Octal Bio Amp from ADinstuments)
-Data digitalization device (in our case we use PoweLab C)
-Needle electrodes (a minimum of 3: positive, negative and ground)
-Labchart or software compatible with the measuring hardware
-Laptop, computer or device to measure and store data
-Precision driller (we use Proxxon micromot) and small drill bit (needle diameter)
Other materials
-Aquaria or container to hold the animals
-Mesh or platform to secure crustaceans
-Cable ties or other devices to secure objects together
-Dental wax
-Aquarium-safe superglue
Before start
1. Load recording program, tailor it for the desired measure (see Analysis) and pre-save it on a file. Also, pre-load annotation for faster (hot key) activation.
2. Check the needle electrodes are working correctly and cover them with dental wax, leaving a needle length long enough to be inserted in the animal (see Procedure).
3. Sedate the animals (if possible) and fix their position on to the restraining mesh or platform.
Experimental setup
Place the recording instruments at a distance or on a separate surface from the one holding the animals (Fig. 1) in their medium (either fresh or seawater). Ensure that the recording device or computer has sufficient memory to prevent measurement interruptions, and verify that a stable electrical current is available to power the equipment.
Fig. 1. Experimental set up example. In our case the Quad- or Octal-Bio Amp is plugged into the PowerLab and a laptop is used to visualize the recordings. The cables are 1.5 m long and the electrodes 0.4 mm wide.
Procedure
Start by drilling holes in the crustacean carapace with a precision driller on the places that flank the brain or desired measurement region (Fig. 2).
Fig. 2. Schematic representation of electrodes placement flanking the brain and ground electrode on the tail (B) of Homarus americanus, with dorsal view of the approximate location of the brain (B).
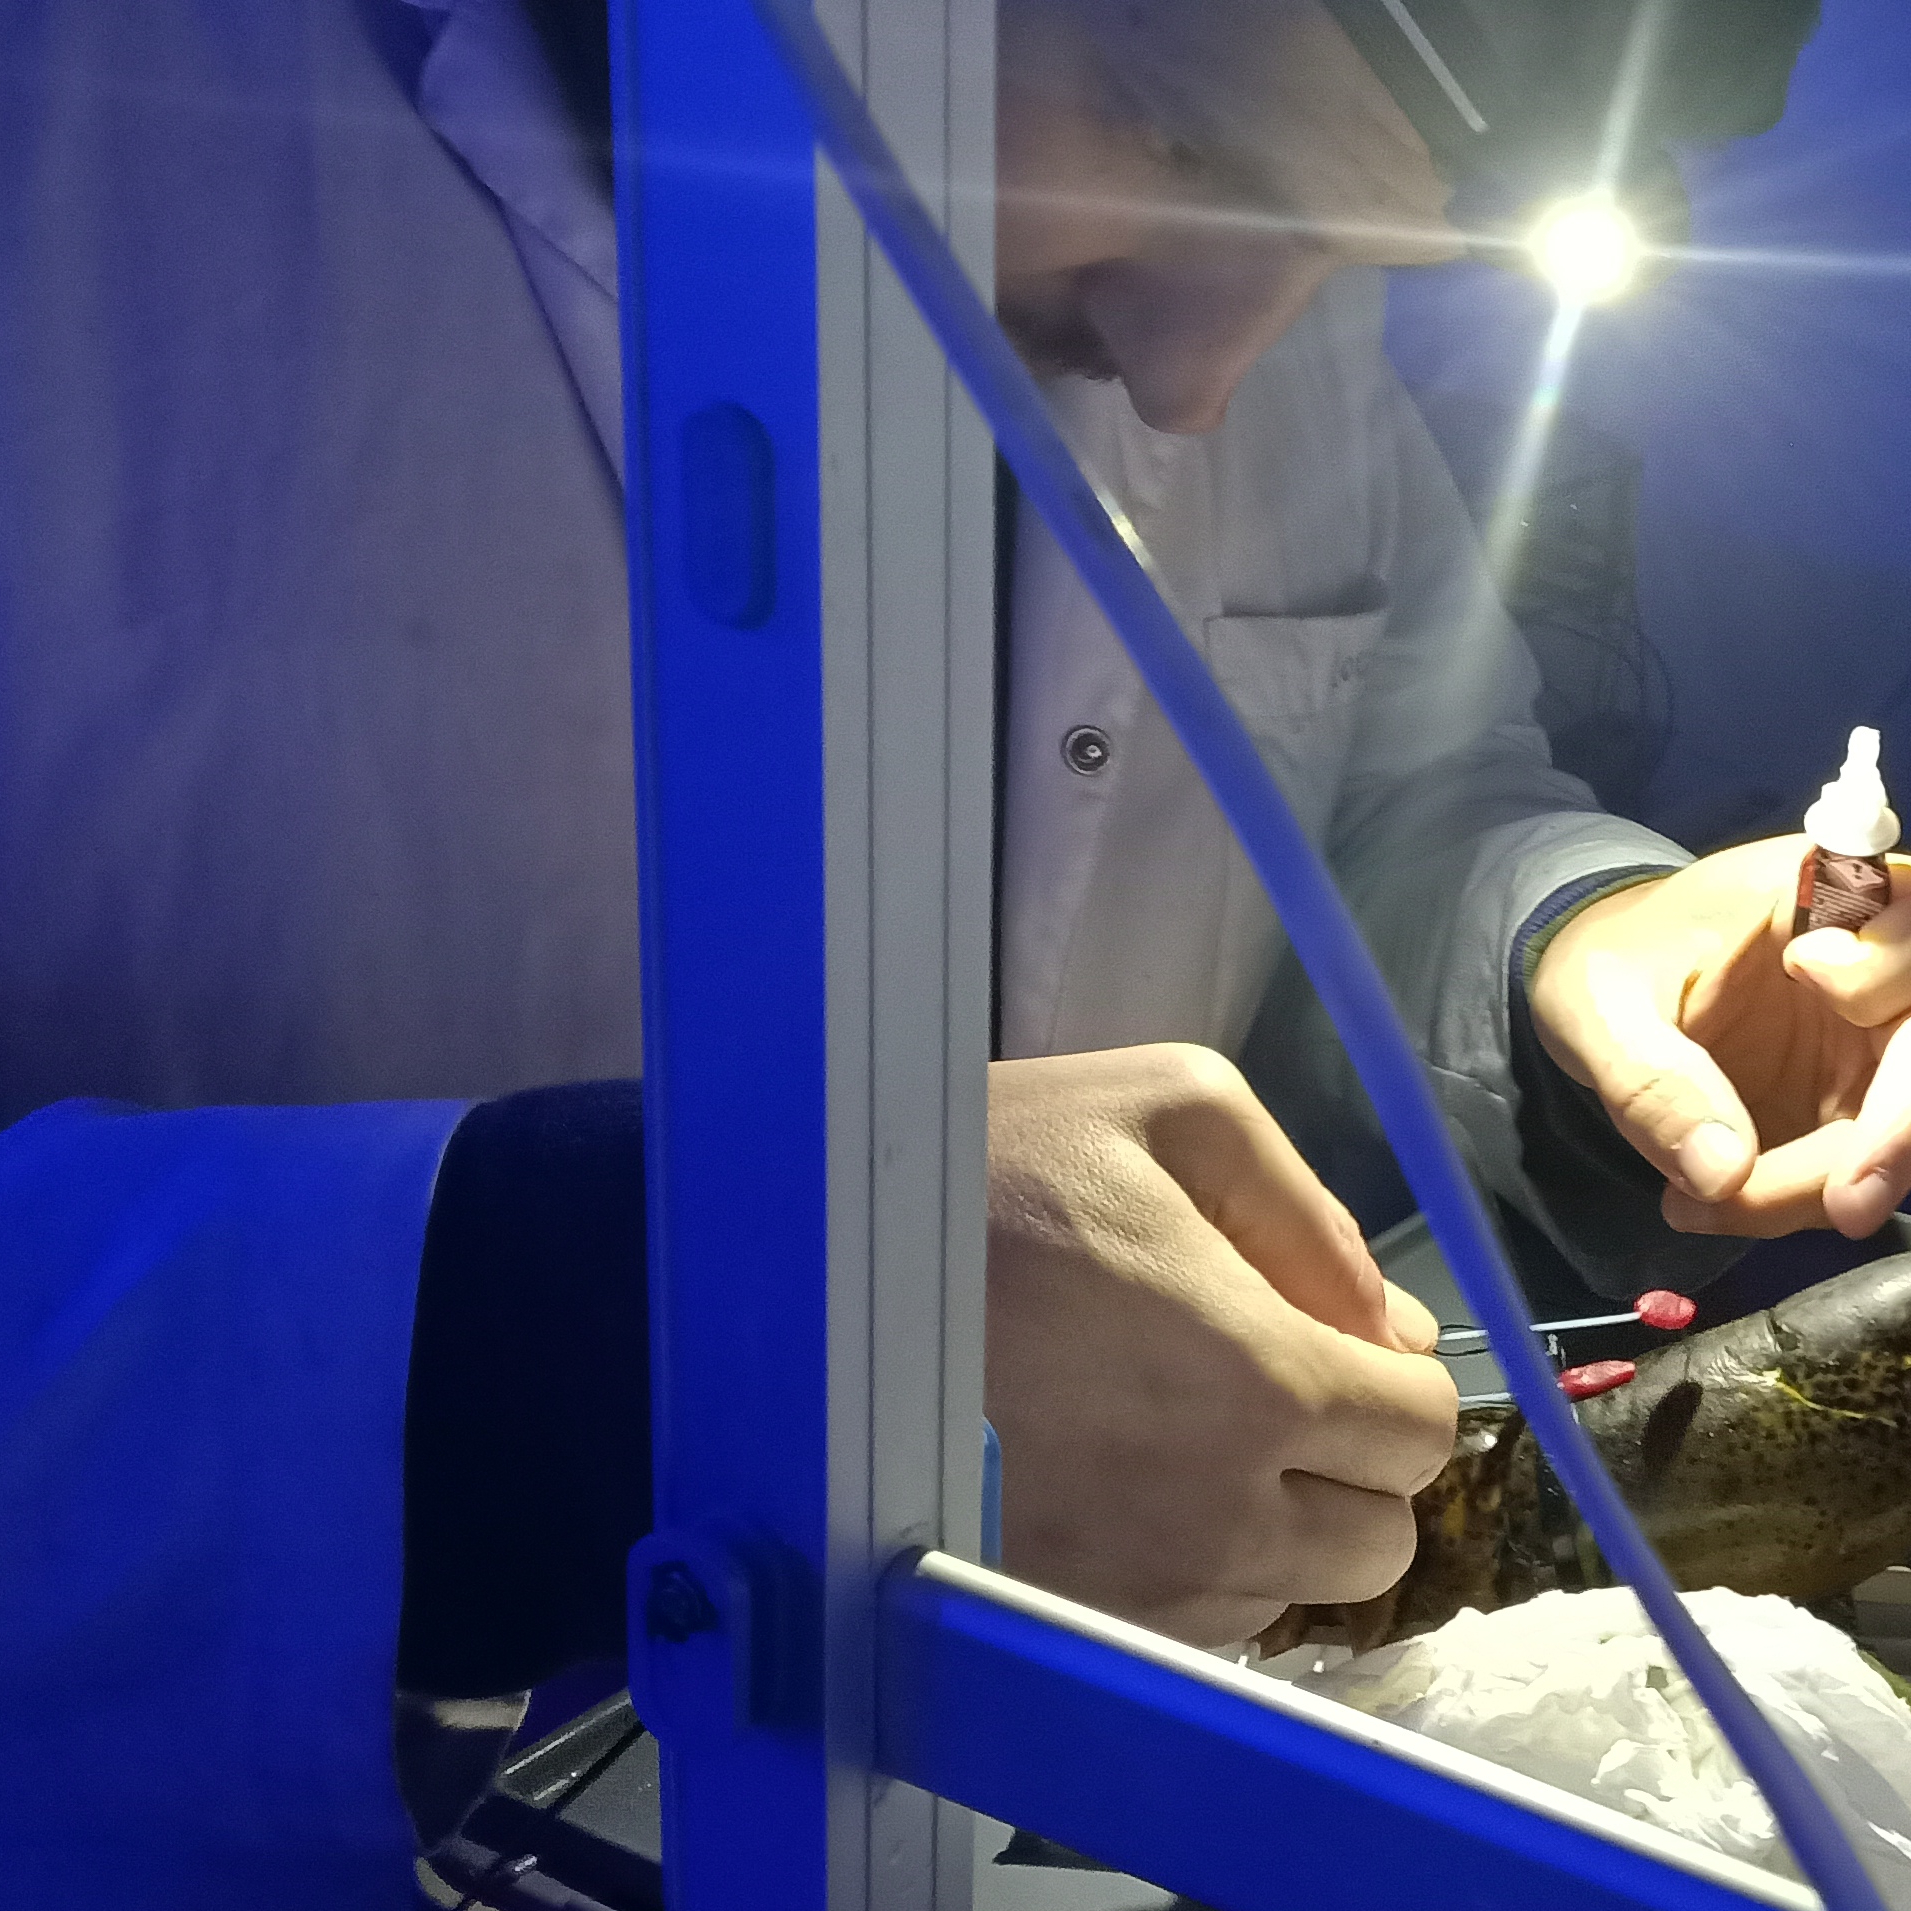
Insert the electrodes (taking into account their polarity +/-) and mark their position down with dental wax. In order to secure them in place, add aquarium-safe superglue to the dental wax and stick it onto the carapace (maintain some pressure till it dies). Place the ground electrode further away (on the tail or claw of the animals) and secure it as well.
Start the recording on the digital device (laptop) and allow some minutes for the system to have a baseline. If there is no recording or the recording is out of scale, re-check the electrodes placement.
After a stable baseline is measured, apply any procedures that may affect the electrical activity of the brain, making comment markers on the file for traceability. Avoid any unnecessary movement or vibrations near the recording devices, for a smooth recording.
Once the whole experimental timeline is finished, stop the recording and save the file immediately.
Gently remove the implanted electrodes from the crustacean to avoid any damage and untie the animal by cutting their bindings. Place the animals back into the maintenance tanks, preferably in isolation to follow up with the recovery.
Analysis and results
Make a digital band filter that includes all the desired brainwave frequencies (0.5-32 Hz is recommended, Fig. 3).
Filter any noise by checking any abrupt change on the voltage recordings.
Perform a spectral analysis on the recordings, the following measures are recommended (yet other could also be useful):
1K Fast Fourier Transformation (FFT) size
Hamming data window
93.75% window overlap
On the Data pad (for Labchart), configure the columns to extract the following information, on the desired filtered channel:
Total power (V^2^)
Median power frequency (F50, Hz)
Spectral edge frequency 95% (SEF, Hz)
Percentage total power low frequencies (0.5-8 Hz)
Percentage total power high frequencies (8-32 Hz)
Fig. 3. EEG distinctive brainwaves that correspond with different states of consciousness.
Software
LabChart
NAME
Windows XP
OS
ADInstruments Australia
DEVELOPER
Establish a time selection of the data, depending on the experimental protocol followed, and add multiple data to Data pad.
Export data and make the intended comparisons.
Protocol references
Bowman, J., Hjelmstedt, P., 6 Gräns, A. (2019). Non-invasive recording of brain function in rainbow trout: Evaluations of the effects of MS-222 anaesthesia induction. Aquaculture Research, 50(11), 3420-3428.
Kells, N. J., Perrott, M., 6 Johnson, C. B. (2023). The efficacy of electrical stunning of New Zealand rock lobster (Jasus edwardsii) and freshwater crayfish (Paranephrops zealandicus) using the Crustastun™. Animal Welfare, 32, e57.
Neil, D. M., Putyora, E., 6 Albalat, A. (2024). Towards the humane slaughter of decapod crustaceans: identifying the most effective indicators of insensibility following electrical stunning. Frontiers in Animal Science, 5, 1378350.
Richter, S., Loesel, R., Purschke, G., Schmidt-Rhaesa, A., Scholtz, G., Stach, T., ... 6 Harzsch, S. (2010). Invertebrate neurophylogeny: suggested terms and definitions for a neuroanatomical glossary. Frontiers in Zoology, 7(1), 29.
Rucinque, D. S., van de Vis, H., Reimert, H., Roth, B., Foss, A., Taconeli, C. A., 6 Gerritzen, M. (2023). Pre-slaughter stunning of farmed Atlantic halibut in CO₂-saturated seawater: assessment of unconsciousness by electroencephalography (EEG). Animals, 13(12), 1993.
Acknowledgements
European Union’s Horizon Europe Project (EUPAHW)
Project ID: 101136346