Apr 01, 2026
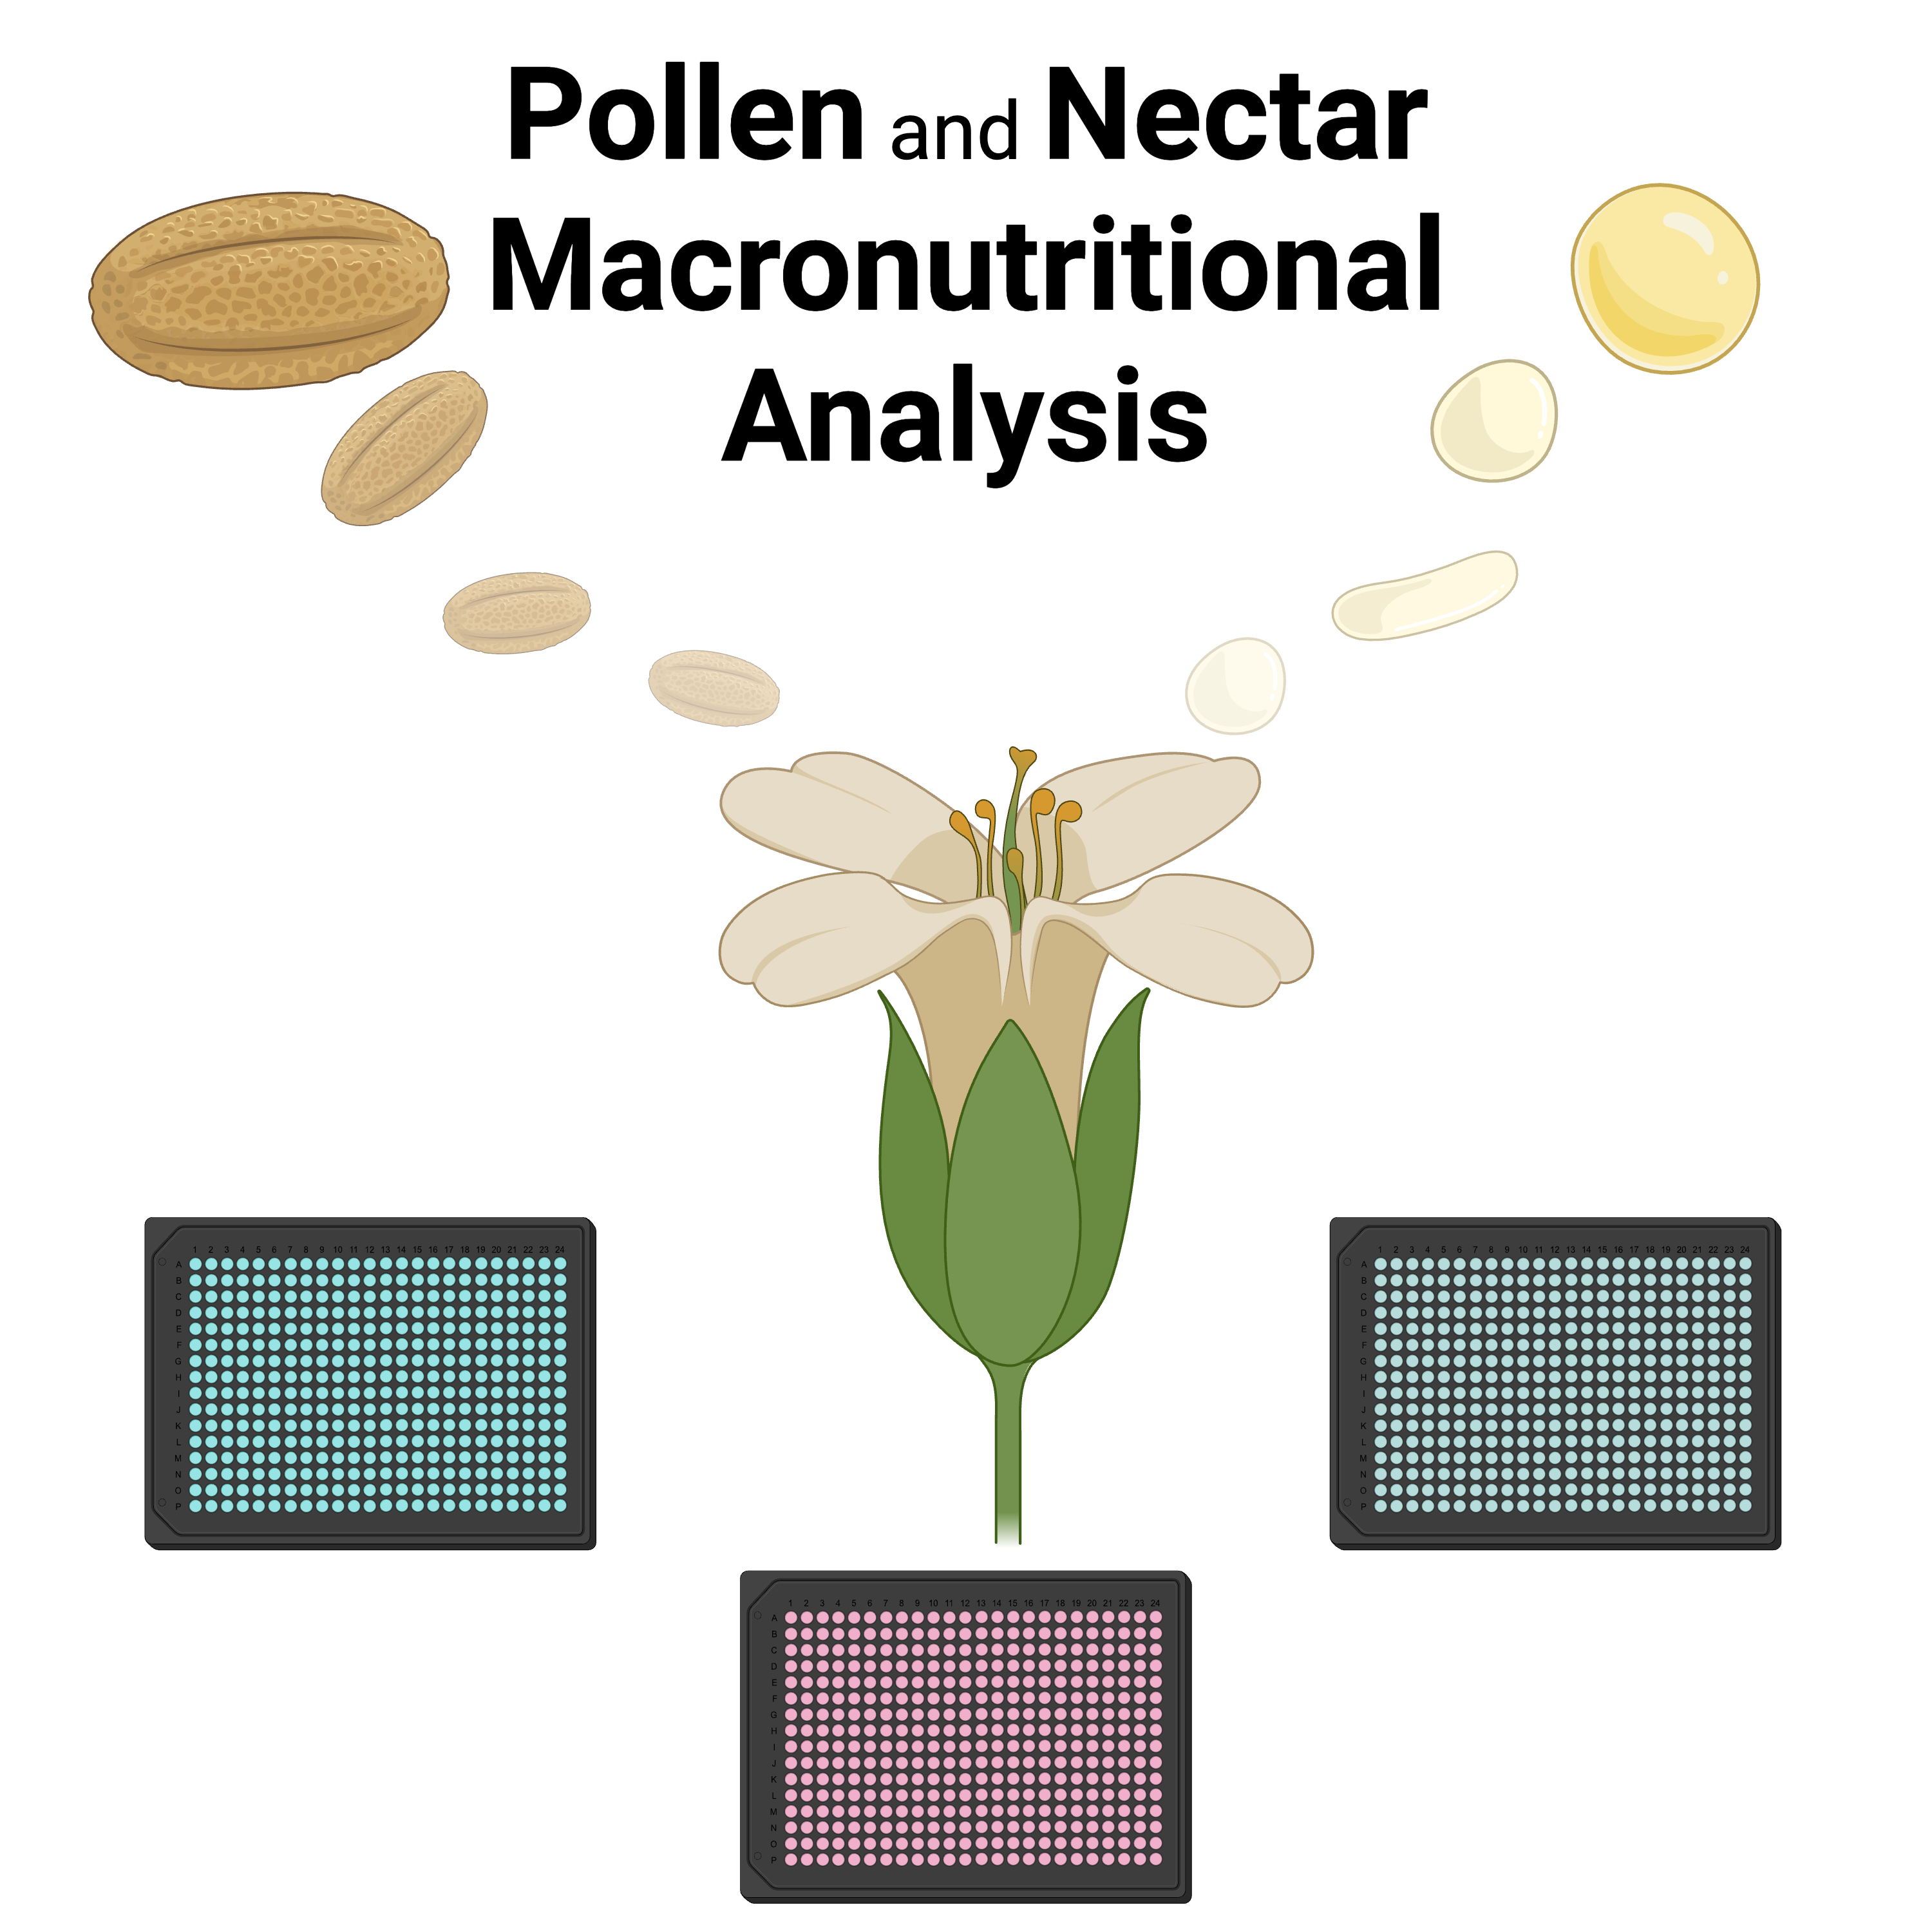
PoNeMA: Pollen and Nectar Macronutritional Analysis
- 1Northumbria University;
- 2Newcastle University
- Foraging Ecology Research Group


Protocol Citation: Beatrice Dale, Katherine Baldock, Jordan Cuff 2026. PoNeMA: Pollen and Nectar Macronutritional Analysis . protocols.io https://dx.doi.org/10.17504/protocols.io.14egn3w96l5d/v1
Manuscript citation:
Cuff, JP, Wilder, SM, Tercel, MPTG, et al. MEDI: Macronutrient Extraction and Determination from invertebrates, a rapid, cheap and streamlined protocol. Methods Ecol Evol. 2021; 12: 593– 601. https://doi.org/10.1111/2041-210X.13551
License: This is an open access protocol distributed under the terms of the Creative Commons Attribution License, which permits unrestricted use, distribution, and reproduction in any medium, provided the original author and source are credited
Protocol status: Working
We use this protocol and it's working
Created: October 06, 2023
Last Modified: April 01, 2026
Protocol Integer ID: 88903
Keywords: macronutrient, nutritional, nutrient, invertebrate, insect, colorimetric assay, entomology, entomological, exoskeleton, lipid, protein, carbohydrate, nectar macronutritional analysis, nectar, macronutrient content, pollen, macronutrient, carbohydrate, comprising carbohydrate, lipid content, quantification in ecological study, colorimetric assay, parallel analysis of lipid, protein, lipid
Funders Acknowledgements:
Newcastle University
Grant ID: Newcastle University Academic Track Fellowship
British Beekeepers Association
Grant ID: R7260
Natural Environment Research Council (NERC)
Grant ID: NE/S007512/1
Abstract
Macronutrients, comprising carbohydrates, proteins and lipids, underpin many ecological processes, but their quantification in ecological studies is often inaccurate and laborious, requiring large investments of time and bulk samples, which make individual‐level studies impossible. This is a protocol for the direct, rapid and relatively low‐cost determination of macronutrient content from both pollen and nectar.
For pollen, macronutrients are extracted by a sequential process of soaking in 1:12 chloroform:methanol solution to remove lipid and then solubilising tissue in 0.1 M NaOH. Nectar, however, requires parallel analysis of lipids, and carbohydrates and proteins from two separate samples but otherwise follows an analogous process. For both sample types, protein, carbohydrate and lipid contents are determined by colorimetric assays.
Image Attribution
Created in BioRender. Cuff, J. (2026) https://BioRender.com/r9ku46l
Guidelines
This protocol is based on the Macronutrient Extraction and Determination from Invertebrates protocol published in Methods in Ecology & Evolution. Many steps have been adjusted to align with the constraints of pollen and nectar samples, but the principles are otherwise the same. The protocol is set up for high-throughput analysis in 384-well plates, but the reagent volumes can be increased (e.g., doubled) for use with 96-well plates.
Materials
Equipment:
Plate spectrophotometer
Plate shaker/vortex (ideally with simultaneous heating functionality)
Incubator/oven
Plate centrifuge
Pipettes (ideally including multi-channels)
Ventilated fume hood
Consumables:
Flat-bottom 384-well colorimetric assay plates for spectrophotometry
Sample tubes (1.5-15 mL, ideally screw-top, for initial sample processing and storage)
Pipette tips
Chloroform
Methanol
0.1 M NaOH
Water (ideally molecular biology grade)
Lipid standard (e.g. analytical lard oil)
Carbohydrate standard (e.g. caster sugar)
Protein standard (e.g. bovine serum albumin)
Vanillin
85% phosphoric acid
Anthrone
Concentrated sulfuric acid
Lowry reagent and 1X Folin-Ciocalteu reagent (or alternative appropriate protein assay kit; often sold together)
Safety warnings
Please read the relevant COSHH and safety documentation for the equipment and reagents involved. Particular care must be taken with the concentrated acids, chloroform and sodium hydroxide included in the protocol.
Before start
Please read the full protocol before starting in order to decide which sections are relevant to your study and how the concurrent steps should be followed, especially regarding extraction of protein and carbohydrate after initial lipid extraction.
Welcome to Pollen and Nectar Macronutritional Analysis (PoNeMA)! This protocol streamlines colorimetric assays for the determination of carbohydrate, lipid and protein content for the analysis of pollen and nectar. The protocol is based on a different protocol purposed for invertebrate samples (Macronutrient Extraction and Determination from Invertebrates) with adjustments based on the specific considerations involved in pollen and nectar samples. There is a step-case to differentiate between pollen and nectar protocols, and the nectar protocol also forks between lipid analysis, and protein and carbohydrate analysis given the need for separate samples for nectar analysis.
Citation
LINK
There are several overnight incubation steps, so don't be alarmed by some of the long procedure times!
Pollen34 steps
Pollen
Collection and preparation of materials
1d 4h 24m
Collect closed flower buds and allow flowers to open in the absence of pollinators (e.g., in a room with relatively stable temperature and humidity). Once the flower stamens are dehiscent, count the number of stamens on the flower and freeze the entire flower head at -20 °C .
Overview of pollen macronutrient extraction.
4h 5m
To isolate pollen grains from organic debris (i.e., other plant tissues), successively rinse the pollen away from the other tissues with isopropanol in a centrifuge tube (e.g., 15 mL Falcon tube). During rinses, crush the plant material with a micropestle or blunt stick, and vortex to separate pollen from other tissue.
10m
Carefully remove the pollen in the isopropanol from the original sample tube into a new sample tube, making sure to leave organic material behind.
5m
Centrifuge 3500 rpm, 00:04:00 the sample tubes containing pollen and isopropanol, and tip away the supernatant. If excessive isopropanol remains after this, carefully pipette it off or evaporate it. The tube containing the pollen pellet can be taken forward for the determination of macronutrient content.
4m
If necessary, desiccate the pollen via freeze-drying (or heat-drying if a solvent-compatible freeze drier is not available) until completely dry.
Note
Heat-drying can be carried out in a 60 °C oven for ~01:00:00 , or a shorter time period if using a heated centrifuge with a vacuum pump. Heat drying is more likely to cause
1d
Determination of lipid content
1d 1h 4m
Add 500 µL of 1:12 chloroform:methanol to each well of the 96-well plate and leave the tube containing the specimen and chloroform:methanol at Room temperature for 24:00:00 .
Note
To make up a master solution of 1:12 chloroform:methanol, mix 77 parts chloroform with 923 parts methanol up to the volume required.
1d
Remove 400 µL of chloroform:methanol solution and keep it in a separate tube for lipid analysis.
Note
Ensure the tube containing the lipids is air tight to avoid evaporation, which will affect downstream concentration values. Importantly, the tube must also be suitable for the storage of chloroform (i.e., won't dissolve) for which glass is ideal.
1m
Discard any remaining supernatant, ideally by pipetting, but the final remaining volume might be easiest to evaporate to avoid disturbing/removing the pollen itself. Repeat STEPS 7-8 by adding 500 µL of 1:12 chloroform:methanol to each well of the 96-well plate and leave the tube containing the specimen and chloroform:methanol at Room temperature for 24:00:00 , and then remove 400 µL of chloroform:methanol solution, this time discarding it.
Note
This step is to remove residual lipids that could interfere with the other assays. It could be skipped if there are any difficulties involved in removing the solvent without removing the pollen, but remember that the residual lipids could cause inaccuracies downstream.
From the original tube containing the remaining chloroform:methanol solution and the pollen, discard the remaining supernatant (having already removed 400 µL for lipid analysis) avoiding the removal of any pollen. It may be easiest to evaporate the remaining solvent.
Note
To remove any residual lipids than can interfere with the other assays, it is recommended for other sample types to repeat the chloroform:methanol soak once more. For pollen, however, there is significant risk of losing pollen in this process if not incredibly careful, so this can be skipped to prioritise sample intactness.
Note
The samples can then be processed straight away for protein and carbohydrate extraction, as per STEP 19.
5m
The lipid content of the 400 µL of chloroform:methanol solution removed earlier can now be determined using the sulfo-phospho-vanillin method.
Overview of lipid determination process.
Prepare a stock standard dilution series using a suitable analogue (e.g. analytical lard oil) of known concentration diluted with 1:12 chloroform:methanol. A dilution series of 0-2 mg/ml in nine increments (0, 25, 125, 250, 500, 750, 1000, 1500 and 2000 μg/ml) should suitably cover a good range of concentrations, but this can be adjusted accordingly.
Note
To make up a master solution of 1:12 chloroform:methanol, mix 77 parts chloroform with 923 parts methanol up to the volume required.
Note
If samples have much lower or higher concentrations of analyte, adjust the standard series accordingly (e.g., if samples have a high concentration, the dilution series could be 0-4 mg/mL ; if low, it could be 0-1 mg/mL ). Diluting or concentrating the samples can achieve similar (and perhaps better, in some cases) results. If the standard series is too highly concentrated, the spectrophotometer may not be able to generate absorbance values; if too low, the data may be more prone to inaccuracy and error.
15m
Make up the vanillin reagent using the following amounts (which should account for reagent overage/pipetting error) per sample/standard repeat (so thrice per sample/standard if running triplicates, as advised). Add the vanillin to the hot (60-80 °C ) water first, then add the phosphoric acid once the vanillin has entirely dissolved.
| A | B | |
| Reagent | Amount per sample | |
| Vanillin | 0.108 mg | |
| Hot water | 18 μl | |
| 85% phosphoric acid | 72 μl |
10m
From each standard and sample, put three repeats of 20 µL into a flat-bottomed 384-well plate and heat at 100 °C in a ventilated hood for 00:05:00 .
Note
If samples are overly concentrated, rather than diluting, you can just add a fraction of the amount of sample (e.g., add 10 µL instead of 20 µL ). This is not true of the other two assays given their lack of an evaporation step. If you do this though, make sure to take a note of the fraction used as this will impact the estimation of lipid content (e.g., if the input is halved, double the output concentrations).
Similarly, you can add double for less concentrated samples, although evaporation times will need to be adjusted accordingly.
5m
Add 10 µL concentrated sulfuric acid to the lipid residues and vortex/mix before incubating again at 100 °C for 00:10:00 .
Note
Incubate longer, up to 00:15:00 , for less concentrated samples
10m
Allow the samples to cool to room temperature and add 75 µL vanillin reagent to each well, vortexing/mixing for homogenous colouration.
3m
Incubate at Room temperature for 00:10:00 .
10m
Measure absorbance at 490 nm using a spectrophotometer.
5m
Determination of protein and carbohydrate content
18h 21m
Add 500 µL 0.1 Mass Percent NaOH to the sample tube. Shake at 1750 rpm, 00:01:00 . Incubate at 80 °C for 00:30:00 to ensure mixture of the lysed material with the NaOH.
31m
Allow the sample to soak overnight at Room temperature .
16h
Centrifuge the sample 1000 x g, 00:01:00 .
1m
Transfer 400 µL of the supernatant into a separate tube for protein and carbohydrate determination.
1m
The carbohydrate content of the 400 µL of NaOH solution removed during STEP 22 can be determined using the anthrone method.
Overview of carbohydrate determination process.
Prepare a stock standard dilution series using a suitable analogue (e.g., glucose, corn starch) of known concentration diluted with polished water. A dilution series of 0-2 mg/mL in nine increments (0, 25, 125, 250, 500, 750, 1000, 1500 and 2000 μg/ml) should suitably cover a good range of concentrations, but this can be adjusted accordingly.
Note
If samples have much lower or higher concentrations of analyte, adjust the standard series accordingly (e.g., if samples have a high concentration, the dilution series could be 0-4 mg/mL ; if low, it could be 0-1 mg/mL ). Diluting or concentrating the samples can achieve similar (and perhaps better, in some cases) results. If the standard series is too highly concentrated, the spectrophotometer may not be able to generate absorbance values; if too low, the data may be more prone to inaccuracy and error.
10m
Make up the anthrone reagent using the following amounts (which should account for reagent overage) per sample/standard repeat (so thrice per sample/standard if running triplicates, as advised):
| A | B | |
| Reagent | Amount | |
| Anthrone | 90 ug | |
| Concentrated sulfuric acid | 90 μl |
5m
From each standard and sample, put three repeats of 20 µL into a flat-bottomed 384-well plate, add 80 µL anthrone reagent to each and vortex/mix.
3m
Incubate the plate at 92 °C in a ventilated hood for 00:10:00 .
10m
Cool the plate to room temperature and measure absorbance at 620 nm using a spectrophotometer.
15m
The protein content of the 400 µL of NaOH solution removed during STEP 22 can be determined using one of several colorimetric protein methods. This protocol will describe the protocol for the Lowry assay. The reagents involved in each of these assays are widely commercially available.
Overview of protein determination process.
Prepare a stock standard dilution series using a suitable analogue (e.g. bovine serum albumin) of known concentration diluted with polished/distilled/molecular biology grade water. A dilution series of 0-2 mg/mL in nine increments (0, 25, 125, 250, 500, 750, 1000, 1500 and 2000 μg/ml) should suitably cover a good range of concentrations, but this can be adjusted accordingly.
Note
Most protein assay kits will allow values to be converted for different standards using standard conversion factors since different standards will differentially affect the results of each assay.
Note
If samples have much lower or higher concentrations of analyte, adjust the standard series accordingly (e.g., if samples have a high concentration, the dilution series could be 0-4 mg/mL ; if low, it could be 0-1 mg/mL ). Diluting or concentrating the samples can achieve similar (and perhaps better, in some cases) results. If the standard series is too highly concentrated, the spectrophotometer may not be able to generate absorbance values; if too low, the data may be more prone to inaccuracy and error.
10m
From each standard and sample, put three repeats of 20 µL into a flat-bottomed 384-well plate, add 60 µL of Modified Lowry Reagent to each and vortex/mix.
5m
Incubate at Room temperature for 00:10:00 .
10m
Add 6 µL of 1X (1N) Folin-Ciocalteu reagent to each well and vortex/mix.
5m
Incubate at Room temperature for 30 min.
30m
Measure absorbance at 750 nm using a spectrophotometer.
5m
Citations
Step 1
Jordan P. Cuff, Shawn M. Wilder, Maximillian P. T. G. Tercel, Rhiannon Hunt, Somoye Oluwaseun, Paige S. Morley, Rafael A. Badell‐Grau, Ian P. Vaughan, James R. Bell, Pablo Orozco‐terWengel, William O. C. Symondson, Carsten T. Müller. MEDI: Macronutrient Extraction and Determination from invertebrates, a rapid, cheap and streamlined protocol
https://doi.org/10.1111/2041-210X.13551Acknowledgements
This protocol was developed in Newcastle University's Molecular Diagnostics Facility.
We thank Dr Matthew Pound for his contribution to the development of the method for removing pollen from plant tissue.