Sep 30, 2021
Nuclei:Cytoplasm EKC Quantification Script (FIJI Macro)
This protocol is a draft, published without a DOI.
- Condon ND1
- 1Institute for Molecular Bioscience, The University of Queensland, Brisbane, Australia


External link: https://doi.org/10.7554/eLife.62196
Protocol Citation: Condon ND 2021. Nuclei:Cytoplasm EKC Quantification Script (FIJI Macro). protocols.io https://protocols.io/view/nuclei-cytoplasm-ekc-quantification-script-fiji-ma-byp5pvq6
Manuscript citation:
https://doi.org/10.7554/eLife.62196
License: This is an open access protocol distributed under the terms of the Creative Commons Attribution License, which permits unrestricted use, distribution, and reproduction in any medium, provided the original author and source are credited
Protocol status: Working
We have used this protocol with no errors.
Created: September 30, 2021
Last Modified: September 30, 2021
Protocol Integer ID: 53725
Keywords: Image Analysis, Quantification, ImageJ, FIJI, macro, EKC, signalling, ratio fluorescence intensity of ekc, cytoplasm ekc quantification script, ratio fluorescence intensity, fluorescence intensity, mean fluorescence intensity, identified nuclei, fluorescence, nuclei signal, nuclei, ekc, cytoplasm, tagged protein, protein of interest,
Funders Acknowledgements:
CZI
Grant ID: 2020-225648
Abstract
This protocol describes how to download, install, and run the ImageJ/Fiji macro for quantifying the ratio fluorescence intensity of EKC in both the nuclei and cytoplasm. This protocol is used in the following eLife paper: https://doi.org/10.7554/eLife.62196
Briefly this macro takes directories of images and processes them in an automonous batch-wise maner. Images should be 2-channel with channel one containing your EKC (or other tagged protein of interest) and channel 2 containing your nuclei signal. Nuclei are segmented and two selection regions are created (nuclei, and a surrounding band that is user definable). These two regions are measure for each identified nuclei and the mean fluorescence intensity is output into a single spreadsheet.
Troubleshooting
Before start
Having an up-to-date version of FIJI/ImageJ is critical for this macro. A fresh installation can be downloaded from Fiji.sc
Downloading & installing the macro
Download the .ZIP copy of the entire repo to your computer, and extract the compressed file.
Launch FIJI/ImageJ on your computer.
Install the plugin into your instance of FIJI by navigating to Plugins > Macros > Install
Choose to install the file called "Nuclei_cytoplasm-measuring_v1-5.ijm"
Running the macro
To launch the installed macro, navigate to Plugins > Macros > Nuclei_cytoplasm-measuring_v1-5
The first window to appear when running the macro describes the Author, Licence and details the tasks the script will run.
The second window warns the user that they will next be required to navigate to the directory which contains the image files. The user should also note the file extension of these files to enter into the upcoming preferences window.
The preferences window prompts the user to input the File extension (for example .tif, .czi, .lsm) as well as the banding distance (in pixels). The user can choose to run in batch mode (faster, background running) or not by selecting the relevant checkbox.
The script will then run through each image within the chosen input directory, identifying nuclei, and measing the EKC signal automonously with no user input required.
Upon completion the script will prompt the user with a dialog box stating "Put down that coffee! Your job is finished"
Reviewing the results
Navigate to the input directory location using your computers filesystem browser.
Select the newly created results directory called "Results<date&time>"
For each image completed the following files are created:
<Filename>_cyto.zip [this contains the ROIs for the cytoplasm measurements]
<Filename>_green-selection.tif [this image is the 32-bit thresholded image of Ch1]
<Filename>_nuclei.zip [this contains the ROIs for the nuclei measurements]
<Filename>_nuclei-mask.tif [this image is the thresholded mask of Ch2]
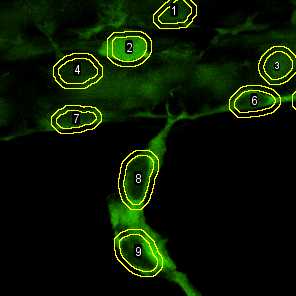
<Filename>_selectionnumbers.png [this image shows the ROI slection numbers corresponding to the quantification results]
For the entire script run the following collated files are create:
Log.txt [this is a copy of the Fiji Log window, with reported script version, settings used, directory location, and file completions]
Results.xls [results spreadsheet for quantification, see below]
Results Spreadsheet information
Note if opening with Microsoft Excel you will see the following warning, this is because the file Results.xls was created outside of Microsft Excel, click Yes to continue opening the document.
The following columns are provided in the Results.xls output file:
Filename: This is the filename for the input image.
Nuclei#: This is the nuclei ID (as per the corresponding output file (<Filename>_selectionnumbers.png)
Nuclei Intensity: This is the measured Mean Intensity for the nuclei selection region
Cytoplasm Intensity: This is the measured Mean intensity for the cytoplasmic band selection region
Number of Nuclei: This is the total number of nuclei identified in this image (not it will repeat for each neclei of this image
Cyto/Nuclei: This is Cytoplasmic Intensity divided by the Nuclei Intensity
Nuclei/Cyto: This is the Nuclei Intensity dividied by the Cytoplasmic intensity