Aug 28, 2023
Version 2
Multiplex IHC Image Processing V0.2 V.2
Forked from a private protocol
- Shamilene Sivagnanam1,2,
- Courtney Betts1,
- Lisa Coussens3
- 1Oregon health and Science University, Cell, Developmental, and Cancer Biology Department, Laboratory of Dr. Lisa Coussens, Portland, OR, USA;
- 2Department of Computational Biology, Oregon Health and Science University, Portland, OR, USA;
- 3Hildegard Lamfrom Endowed Chair in Basic Science Professor and Chairwoman, Department of Cell, Developmental & Cancer Biology Oregon Health & Science University Deputy Director for Basic & Translational Research, Knight Cancer Institute
- NCIHTAN


External link: https://doi.org/10.1038/s41467-024-52528-7
Protocol Citation: Shamilene Sivagnanam, Courtney Betts, Lisa Coussens 2023. Multiplex IHC Image Processing V0.2. protocols.io https://dx.doi.org/10.17504/protocols.io.n92ldmmznl5b/v2Version created by Shamilene Sivagnanam
Manuscript citation:
Baretti, M., Danilova, L., Durham, J.N. et al. Entinostat in combination with nivolumab in metastatic pancreatic ductal adenocarcinoma: a phase 2 clinical trial. Nat Commun 15, 9801 (2024). https://doi.org/10.1038/s41467-024-52528-7
License: This is an open access protocol distributed under the terms of the Creative Commons Attribution License, which permits unrestricted use, distribution, and reproduction in any medium, provided the original author and source are credited
Protocol status: Working
Created: August 28, 2023
Last Modified: August 28, 2023
Protocol Integer ID: 87052
Keywords: multiplex, multiplex imaging, image analysis, immune characterization, cell classification, tumor microenvironment, TME, imaging, bioimaging, multiplex IHC, immune phenotyping, immune contexture, tumor immune, quantitative multiplex immunohistochemistry, dimensional multiplexed immunohistochemical characterization of immune contexture, dimensional multiplexed immunohistochemical characterization, multiplex ihc, image processing pipeline for mihc svs image, mihc svs image, immunohistochemistry, leukocyte heterogeneity, leukocyte heterogeneity in pancreatic ductal adenocarcinoma, immune complexity, image processing pipeline, immune composition, valuable insight to tumor, immune contexture, immune system, simultaneous detection of multiple ab target, human cancer, ihc, inflamed tumor, image processing,
Abstract
Understanding immune complexity within the tumor microenvironment provides valuable insight to tumor-immune composition, spatial interactions, and the immune system's reaction to therapy allowing us to better understand response and resistance at the interface of the tumor and host.
Multiplex IHC allows for the simultaneous detection of multiple Ab targets in the same tissue section using published methods previously described1,2,3.This protocol contains detailed instructions on how to prepare files and run the image processing pipeline for mIHC SVS images in a GUI or command line, making it accessible to biologist and labs without computational specialty.
- Tsujikawa, Takahiro, et al. "Quantitative multiplex immunohistochemistry reveals myeloid-inflamed tumor-immune complexity associated with poor prognosis."Cell reports19.1 (2017): 203-217
- Banik, Grace, et al. "High-dimensional multiplexed immunohistochemical characterization of immune contexture in human cancers."Methods in enzymology635 (2020): 1-20.
- Liudahl SM, Betts CB, Sivagnanam S, et al. "Leukocyte Heterogeneity in Pancreatic Ductal Adenocarcinoma: Phenotypic and Spatial Features Associated with Clinical Outcome." Cancer Discov. 2021;11(8):2014-2031. doi:10.1158/2159-8290.CD-20-0841
Guidelines
This protocol is specifically for chromogenic multiplexIHC image processing using images scanned with Leica, Aperio ScanScope in the .SVS format.
Before start
Make sure you have access to the following commercial softwares:
- Leica, Aperio ImageScope (free, Windows only)
Software
ImageScope
NAME
Leica, Aperio
DEVELOPER
- Matlab R2018b or R2019b (license required)
Additional toolboxes required: Computer Vision Toolbox
File prep and Folder Structure
FOLDER AND FILE NAMING CONVENTION
Make sure folder and file naming convention is consistent throughout the entire study. Filenaming convention should be used when saving images during acquisition.
Note
NAMING SLIDE FOLDERS AND IMAGE FILES
Each slide folder in a cohort batch should maintain some consistent format of letters and numbers:
Example slide folder name: 1 letter, 6 numbers
H342253
H342259
Each newly scanned image from one slide should be named with the following file naming convention at acquisition:
Initials_StudyID_UniqueSlideID_PanelName_CycleRound_Marker.SVS
Example file name:
GG_HTAN1_H342253_D18_C01R1_PD1.svs
GG_HTAN1_H342253_D18_C01R2_PDL1.svs
SET UP FOLDER STRUCTURE
The pipeline is optimal for batches of slides that run from a 'Parent' folder, that is the study or batch directory.
Folder structure for a cohort of slide images.
The study folder structure should be organized as the cohort/study/batch of slides as the parent folder, with each slide within the study containing all marker files with no duplicate scans of markers.
There should be an initial hematoxylin, a second hematoxylin after antigen retrieval, and a third hematoxylin at the end of the panel - see mIHC wet lab protocol for details:
Below is an example of the folder structure of a study called HTAN1 that contains 1 slide (H342253), 17 marker images, and 3 hematoxylin stained images.
Note
Example study folder structure:
├── HTAN1 (Parent Study)
│ ├── H342253 (Slide 1)
│ │ ├── GG_HTAN1_H342253_D18_C00R1_HEM.svs
│ │ ├── GG_HTAN1_H342253_D18_C01R1_PD1.svs
│ │ ├── GG_HTAN1_H342253_D18_C01R2_PDL1.svs
│ │ ├── GG_HTAN1_H342253_D18_C01R3_HEM.svs
│ │ ├── GG_HTAN1_H342253_D18_C02R1_HLADPDQDR.svs
│ │ ├── GG_HTAN1_H342253_D18_C02R2_DCLAMP.svs
│ │ ├── GG_HTAN1_H342253_D18_C03R1_CD3.svs
│ │ ├── GG_HTAN1_H342253_D18_C03R2_CD45.svs
│ │ ├── GG_HTAN1_H342253_D18_C04R1_CD8.svs
│ │ ├── GG_HTAN1_H342253_D18_C05R1_GRZB.svs
│ │ ├── GG_HTAN1_H342253_D18_C05R2_CD20.svs
│ │ ├── GG_HTAN1_H342253_D18_C06R1_CD68.svs
│ │ ├── GG_HTAN1_H342253_D18_C07R1_CD66B.svs
│ │ ├── GG_HTAN1_H342253_D18_C07R2_CD11C.svs
│ │ ├── GG_HTAN1_H342253_D18_C08R1_CD163-001.svs
│ │ ├── GG_HTAN1_H342253_D18_C09R1_EOMES.svs
│ │ ├── GG_HTAN1_H342253_D18_C10R1_FOXP3.svs
│ │ ├── GG_HTAN1_H342253_D18_C11R1_KI67.svs
│ │ ├── GG_HTAN1_H342253_D18_C11R2_PANCK.svs
│ │ ├── GG_HTAN1_H342253_D18_C11R3_HEM.svs
Get Code and Required Software
DOWNLOAD SOFTWARE AND CODE
Download or clone the MultiplexIHC_Code.zip file that contains all the functions and code for image processing. Save and unzip this folder somewhere other than your Downloads directory.
[email protected]:Sivoyer/MultiplexIHC_Code.git
In addition to this code, you will also need the following software installed:
Registration is performed in Matlab R2018b or higher:
Additional toolboxes required: Computer Vision Toolbox
Color Deconvolution and Nuclei Segmentation is performed in FIJI:
Additional files required:  RGB_to_CMYK.class
To install this .class file, drag and drop into FIJI bar, then close and restart the program.
Single Cell Quantification is performed in Cell Profiler 3:
Pipeline Overview
PIPELINE OVERVIEW
Once file names and folder structure is properly formatted for mIHC image processing, batch analysis can be performed. For every slide, multiple regions can be selected, avoiding regions of tissue deformation, necrosis, or other artifact or trouble tissue regions.
The image processing workflow utilizes steps commonly found in biological image analysis that have been optimized for brightfield RGB multplexIHC images with AEC chromogen and hematoxylin. Although image processing can be completely automated, it is highly recommended that each step is checked to ensure data is as expected and is of high enough quality to continue processing. The modular steps allow for QC and adjustments at each major step.
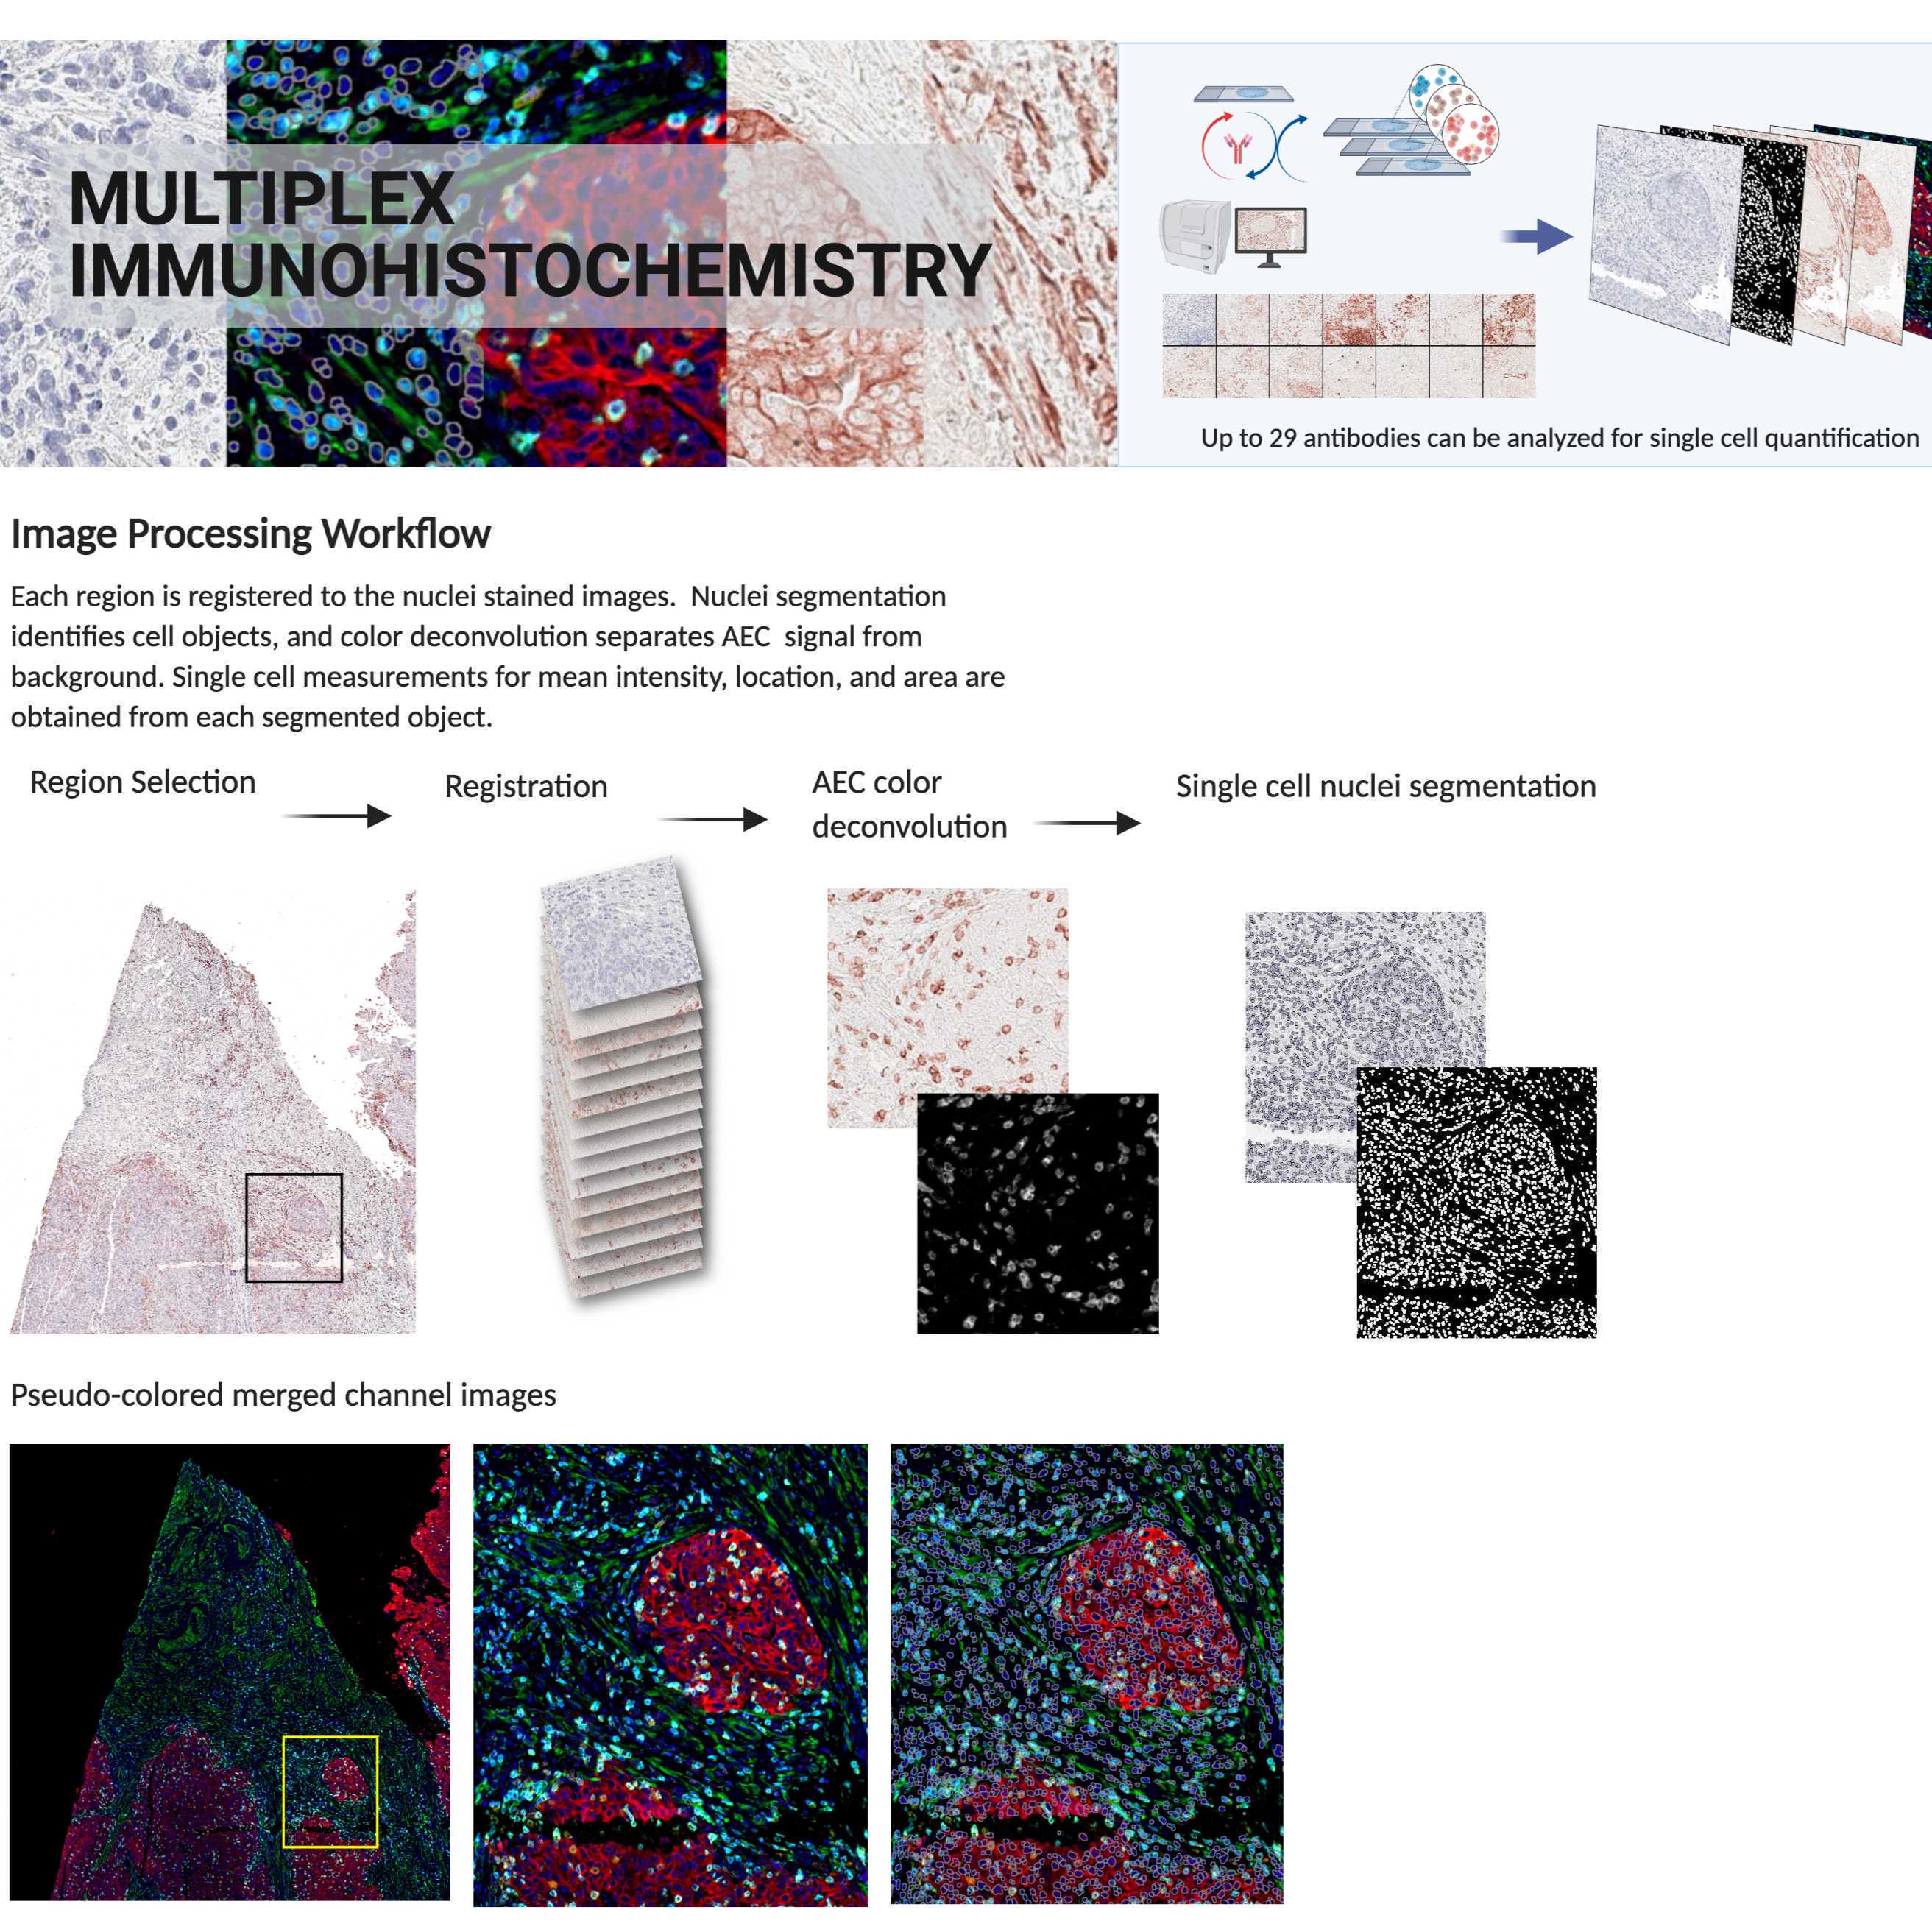
Brief Description of Image Processing Workflow
Each region is registered to the final stained hematoxylin image from the same area, aligning each image such that major shifts due to repetitive scanning are adjusted for. Color deconvolution separates the AEC conjugated Ab signal from background. Single cell nuclei segmentation identifies cell areas using hematoxylin stain. Each identified cell is measured for mean intensity of every signal extracted marker.
Overview of image processing workflow
Region of Interest Selection
SELECT REGIONS OF INTEREST
Regions are annotated in Aperio ImageScope, available for Windows only.
Software
ImageScope
NAME
Leica, Aperio
DEVELOPER
Annotating Regions on final hematoxylin
Regions of interest are annotated on the last hematoxylin image to ensure that only cells maintained throughout all staining cycles and rounds are evaluated in downstream analysis.
Tissue areas that are lost, deformed, folded, or of poor quality should be excluded from analysis.
Note
DRAWING REGIONS IN IMAGESCOPE
1. Open the last cycle hematoxylin image in ImageScope.
Example: GG_HTAN1_H342259_D18_C11R3_HEM.svs
2. Select the rectangle tool for annotating boxes.
3. Draw boxes on areas of tissue that are of good quality (no folds, tissue loss, tissue deformation
- Box sizes can be uniformly sized in settings, but only square/rectangle regions accepted.
- Boxes should consist of tissue area with <= ~65000 cells
(constraint of ROI cell classification downstream if using FCS Express Image Cytometry)
4. When ROIs have been annotated, you can view the list of them on the Annotations - Detailed View in ImageScope
For more instructions on using Aperio ImageScope please see the manual: ImageScopeUserGuide.pdf
Annotations - Detailed View shows region annotations
5. Close the SVS file and you will be prompted to save annotations. Select yes, and ImageScope will save an XML with the same filename as the image it was drawn on (last hem). Do not rename or move this file out of the slide folder containing the SVS images.
Pipeline Run Options
This can be run using the software interfaces (code free), or by terminal. Instructions for both methods are listed below:
Run mIHC Image Processing via Command Line6 steps
MacOS
Image Registration
IMAGE REGISTRATION
How registration works:
Image registration is performed in Matlab. Each marker image is registered to the last cycle target hematoxylin image. Keypoints are identified on the blue channel of the hematoxylin image and the blue channel of the AEC marker image.
If not enough matching keypoints are found, other single RGB channels are checked for more keypoints, and the channels with the highest strongest matching indexed keypoints are used. A similarity based geometric transform is generated and applied to each channel of the marker image and merged. The registered RGB image is saved as a TIFF inside an automatically generated 'Registered_Regions' folder created in the slide/region folder.
Workflow of image registration for each region of an image.
Command
code template to run matlab registration from linux mac on command line (macOS High Sierra 10.13.6)
Run MultiplexIHC Registration
- Replace <path/to/matlab> with the path to your matlab application. For macOS, it is likely: /Applications/MATLAB_R2018b.app/bin/matlab
- Replace <path/to/matlab/code-dir> with the path to the location where you saved the MultiplexIHC_RegistrationCode directory.
- Replace <path/to/Parent-dir> with the path to your Parent directory containing all slides to be registered.
Example:
"/Applications/MATLAB_R2018b.app/bin/matlab" -nodesktop -nosplash -r "cd('/Users/sivagnan/MultiplexIHC_Code/CommandLine/CL_Registration');run_mIHC_registration('/Users/sivagnan/PROJECTS/Cohort1');exit;"
Image Registration Quality Control
REGISTRATION QC
When registration is complete, you will see a Registered_Regions directory created inside each slide folder with an ROI folder for each region box annotation. Each ROIxx folder contains all marker images for that region with reg_ prepended to the filename.
A new folder called 'Registration_Check' will be created in the Parent directory that contains low resolution images of all registered regions for every slide in the batch. Each low res image will have 'regck_' prepended to the filename. This image set can be used to quickly check the images for gross misregistration or images that were were false registered (passed but should have failed). Regions or stains that did not adequately register well enough for quantification due to tissue deformation or loss are removed from further analysis.
Folder structure after registration has completed. Folders in yellow are automatically generated during registration
If registration failed for a marker or region, you will see a 'Redo_ROI' folder inside the slide folder containing the failed marker region and the hematoxylin region that failed registration.
Images that failed registration can be excluded from further downstream analysis, or manually registered. See Troubleshooting guide ### for how to register images - 'Manual Registration' XXX.
Signal Extraction
AEC COLOR DECONVOLUTION
Color deconvolution separates the AEC signal from the tissue background to quantify signal.
AEC signal is extracted using an RGB to CMYK conversion which utilizes a maximum gray component replacement to subtract the lowest gray level from all channels. AEC chromogen signal is separated into the ‘Y’ and 'M' channels and the 8-bit image channels are added together. Pixel results greater than 255 are set to 255. The middle 90% of pixels are rescaled to 0-255 (Pham et al. 2007).
Left: Raw image with AEC stain for CD3
Right: Signal extracted CD3 signal post color deconvolution
Command
code template to run FIJI macros from mac on command line (MacOS HighSierra 10.13.6)
Run FIJI Macro
EXAMPLE:
Java -jar /Applications/Fiji.app/jars/ij-1.52p.jar -ijpath /Applications/Fiji.app -batch /Users/sivagnan/MultiplexIHC_Code_072020/CommandLine/AEC_CMYK_ColorDecon.txt /Users/sivagnan/PROJECTS/Cohort1/
The script runs on the Parent directory and creates a directory in each slide called 'Processed' with ROI folders inside; same folder structure as 'Registered_Regions'. Each generated image will have 'V_' prepended to the filename.
Folder structure after registration and color deconvolution. Yellow folders created during registration. Green folders created during color deconvolution.
Segmentation
NUCLEI SEGMENTATION
Segmentation is performed using the StarDist 2D_versatile_fluo algorithm implemented in FIJI python:
(Martin Weigert, Uwe Schmidt, Robert Haase, Ko Sugawara, and Gene Myers.
Star-convex Polyhedra for 3D Object Detection and Segmentation in Microscopy.
The IEEE Winter Conference on Applications of Computer Vision (WACV), Snowmass Village, Colorado, March 2020)
Segmentation can be performed on any single channel nuclear stain, preferably from the end of the staining panel to ensure only cells maintained throughout all staining cycles are evaluated downstream. If using a nuclear stain early in the panel, tissue and cells lost during the staining process can result in false negatives. We have optimized an antibody cocktail of H3+Nuclear Antigen to robustly identify single cell nuclei and this is recommended for segmentation in this pipeline.
Left to right: raw IHC image, signal extracted image, labeled cell objects
BatchStardistSegmentation_H3NUCA.py
The script runs on the Parent directory and creates a labeled image for each ROI inside the Processed folder with a prefix, 'label_', based on the nuclei image named with 'V_H3NUCA_*'. This can be modified to identify any nuclei image name.
Single Cell Measurements
SINGLE CELL MEASUREMENTS
Single cell measurements are performed in Cell Profiler. Although there are many methods to measure mean intensity values for masked objects, this workflow utilizes Cell Profiler due to the output compatibility with FCS Express Image Cytometry for single cell classification. Measurements necessary for single cell gating are mean intensity for each marker, object area, object index, and object centroid X,Y location coordinates.
There are specific nomenclature that is required in order for the cell profiler output file to work properly in FCS Express Image Cytometry.
See the attached document on how to use the template Cell Profiler project, which can be found in the MultiplexIHC_Code directory.
Command
python command to run a cell profiler batch.h5 file on linux for batch processing (Linux)
Run batch Cell Profiler project in linux
Example of running 50 image sets from the file Batch_data.h5 located in the project folder, Cohort1, on Linux:
./python -m cellprofiler -p /Users/sivagnan/PROJECTS/Cohort1/Batch_data.h5 -c -r -b -f 1 -l 50
Command
running batch image sets using a batch.h5 file on Mac (High Sierra 10.13.6)
Running a batch of image sets
Example of running 50 image sets from the file Batch_data.h5 located in the project folder, Cohort1 on MacOS (change CellProfiler version to your version):
/Applications/CellProfiler-3.1.5.app/Contents/MacOS/cp -c -r -p /Users/sivagnan/PROJECTS/Cohort1/Batch_data.h5 -f 1 -l 50
This command submits the batch file to CellProfiler and specifies that CellProfiler run in a batch mode without its user interface to process the pipeline. This run can be modified by
using additional options to CellProfiler that specify the following:
- -p <Default_Output_Folder_path>/Batch_data.h5: The location of the batch file, where <Default\_Output\_Folder\_path> is the output folder path as seen by the cluster computer.
- -c: Run “headless”, i.e., without the GUI
- -r: Run the pipeline specified on startup, which is contained in the batch file.
- -b: Do not build extensions, since by this point, they should already be built.
- -f <first_image_set_number>: Start processing with the image set specified, <first_image_set_number>
- -l <last_image_set_number>: Finish processing with the image set specified, <last_image_set_number>
Visualization stack (optional)
CONVERT TO OME.TIFF
The 'V_' prepended images are your registered, signal extracted, single channel 8-bit final image. Each set of images within an ROI can be converted into a single ome.tif using bioformats to create Level 2 data.
Protocol references
Carpenter AE, Jones TR, Lamprecht MR, Clarke C, Kang IH, Friman O, et al. CellProfiler: image analysis software for identifying and quantifying cell phenotypes. Genome Biol 2006;7(10):R100 doi 10.1186/gb-2006-7-10-r100.
Schindelin J, Arganda-Carreras I, Frise E, et al. Fiji: an open-source platform for biological-image analysis. Nat Methods. 2012;9(7):676-682. Published 2012 Jun 28. doi:10.1038/nmeth.2019
Pham, NA., Morrison, A., Schwock, J. et al. Quantitative image analysis of immunohistochemical stains using a CMYK color model. Diagn Pathol 2, 8 (2007). https://doi.org/10.1186/1746-1596-2-8