Jul 04, 2025
Microplate Beta Glucan Assay
- Anneke Prins1
- 1Rothamsted Research


Protocol Citation: Anneke Prins 2025. Microplate Beta Glucan Assay . protocols.io https://dx.doi.org/10.17504/protocols.io.kqdg31e1el25/v1
License: This is an open access protocol distributed under the terms of the Creative Commons Attribution License, which permits unrestricted use, distribution, and reproduction in any medium, provided the original author and source are credited
Protocol status: Working
We use this protocol and it's working
Created: July 02, 2025
Last Modified: July 04, 2025
Protocol Integer ID: 221568
Keywords: beta glucan, mixed linkage glucan, dietary fibre, cereal fibre, microplate beta glucan assay, glucan content of cereal grain flour, quantification with glucose oxidase, glucose, amount of glucose, glucan content, white flour supernatant, glucose oxidase, cloudiness in white flour supernatant, wise hydrolysis of the polysaccharide, cereal grain flour, glucose standard curve, polysaccharide, assay result, assay measures the mixed linkage beta, enzyme, assay measure, megazyme kit, wise hydrolysis, peroxidase, mg of dry sample, coloured solution, wet sample, assay
Funders Acknowledgements:
BBSRC
Grant ID: BB/X011003/1
Abstract
This assay measures the mixed linkage beta glucan content of cereal grain flour through specific, enzyme-catalysed, step-wise hydrolysis of the polysaccharide to glucose and quantification with glucose oxidase/peroxidase (GOPOD) reagent. The assay results in a coloured solution where the amount of glucose in the solution is directly proportional to the amount of light absorbed at a wavelength of 510 nm.
The assay is an adaptation of the protocol as specified in the Megazyme Kit (K-BGLU1) and uses the reagents as provided by the kit. Here the reaction volumes have been decreased 10-fold and the proportionate amount of 50% (v/v) ethanol used to wet samples has been increased to accommodate up to 20 mg of dry sample. The centrifugation speed (step 9) was increased to reduce cloudiness in white flour supernatant and the glucose standard curve expanded to improve accuracy.
Guidelines
Standard curve setup
- Subtract the average absorbance value of the 0 µg D-glucose standard from all other standards (this is done automatically in some software applications when the 0 µg samples are specified as "blanks").
- Plot the mean absorbance (A510) of standards against the amount of D-glucose and draw a regression line through the points. Use the equation of the regression line to calculate the amount of glucose in samples using their correspond A510 values (see Calculations section).
Absorbance at 510 nm (A510) versus glucose content in standard solution after incubation with GOPOD reagent.
Calculations
For each sample, calculate the amount of beta glucan (% w/w 'as is') as follows:
- Subtract the average A510 of the control assays (n=2) from the average A510 of the test assays (n=2).
- Calculate the amount of glucose this value represents using the standard curve.
- Multiply this value by 94 to express glucose in the original volume (940 µL).
- Multiply this value by 162/180 to convert from free D-glucose to anhydro-D-glucose.
- Convert this value (µg anhydro D-glucose) to mg by dividing by 1000.
- Divide the resultant value (mg anhydro D-glucose) by the weight of the sample in mg and multiply by 100 to express as % w/w.
Comments on specific steps
Step 4: Rapid shaking is essential to counteract gel formation in some samples, such as white wheat flour. Without shaking the measurements become highly variable due to heterogeneous extraction.
Step 10: Because assay volume is so small (20 µL), a 1.5 mL conical tube is preferred to optimise interaction between enzyme and substrate. A round-bottomed 2 mL tube is unsuitable as the mixture is spread over too large a surface.
Step 11: All extracts are measured in duplicate, with duplicate blanks. This is due to variability in the assay particularly when applied to samples with low beta glucan content. Operators measuring beta glucan in samples with higher content can adjust this step according to their own requirements.
Step 13: If doing two rounds of assays in succession, the second round can be started once GOPOD reagent has been added to the samples from the first round.
Step 15: Because the 0 µg D-glucose standards are critical to drawing an accurate standard curve, preparing more than 2 technical replicates is highly recommended. This is also important if samples contain low amounts of beta glucan (< 0.4%) since noise in the 0 µg standard can affect measurements taken from these samples. We routinely prepare quadruplicate technical replicates of the 0 µg D-glucose standard.
Limiters
The major limiter in this assay is the number of thermal mixers available. To assay 8 samples (2 x test and 2 x control for each sample) with a standard curve consisting of 5 concentrations, we use 2 x thermal mixers with 1.5 mL blocks set at 50 °C (2 x 24 slots for tubes), 1 x thermal mixer with a 2.0 mL block at 50 °C (24 slots for tubes) and 1 x thermal mixer with a 1.5 mL block at 99°C (24 slots for tubes).
Testing GOPOD reagent
With each new batch of GOPOD reagent, the time to maximum colour formation with 100 µg D-glucose standard should be checked. This is usually approximately 15 minutes. To test this, a kinetic reading can be taken in a plate reader over e.g. 20 minutes.
Suggested plate layout
| A | B | C | D | E | F... | |
| 0 µg glucose | 0 µg glucose | Test-1 | Test-1 | Control-1 | Control-1 | |
| 1.25 µg glucose | 1.25 µg glucose | Test-2 | Test-2 | Control-2 | Control-2 | |
| 2.5 µg glucose | 2.5 µg glucose | Test-3 | Test-3 | Control-3 | Control-3 | |
| 5 µg glucose | 5 µg glucose | Test-4 | Test-4 | Control-4 | Control-4 | |
| 7.5 µg glucose | 7.5 µg glucose | Test-5 | Test-5 | Control-5 | Control-5 | |
| 10 µg glucose | 10 µg glucose | Test-6 | Test-6 | Control-6 | Control-6 | |
| 0 µg glucose | 0 µg glucose | Test-7 | Test-7 | Control-7 | Control-7 | |
| Test-8 | Test-8 | Control-8 | Control-8 |
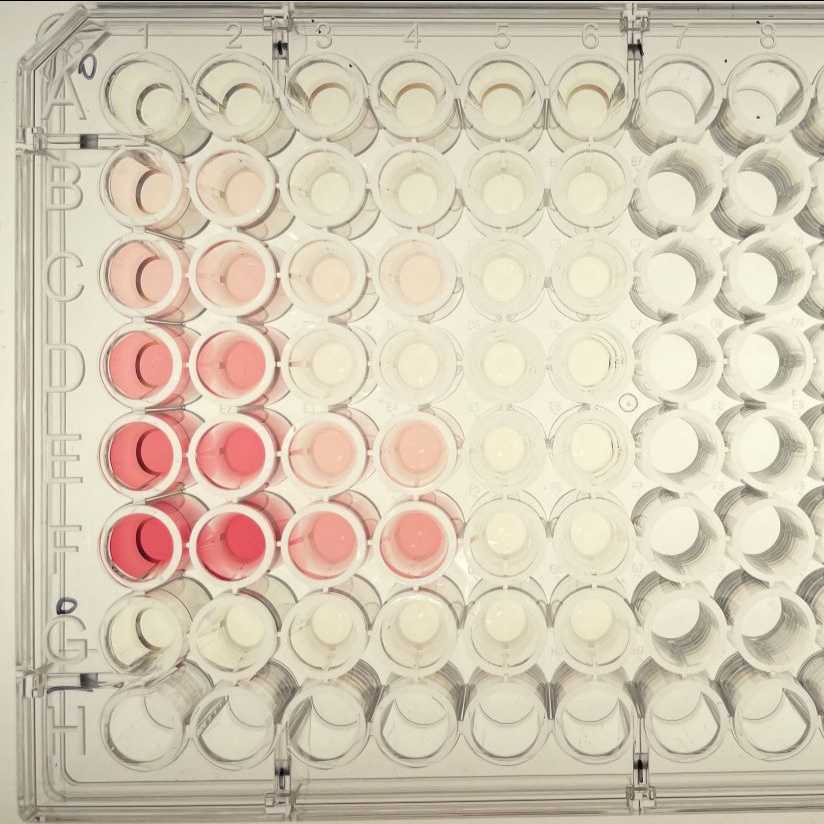
Example of results using the plate layout above (wells A1 to G6 used)
Materials
- Ethanol 50% (v/v).
- 20 mM sodium phosphate (pH 6.5).
- 200 mM sodium acetate (pH 4.0).
- 50 mM sodium acetate (pH 4.0).
- D-glucose (1 mg/ mL) standard solution (from Megazyme kit).
- Control barley or oat flour with known beta glucan content (from Megazyme kit).
- Lichenase (from Megazyme kit).
- Beta-glucosidase (from Megazyme kit).
- Glucose-oxidase/peroxidase (GOPOD) reagent (from Megazyme kit). [NOTE: contains 0.09% NaN3]
- Microcentrifuge tubes (1.5 mL and 2.0 mL).
- Micropipettes (should be able to dispense volumes between 1.25 uL and 500 uL) and tips.
- 96-well flat-bottomed microplate.
- Vortex mixer.
- Thermal mixers with blocks that can accommodate 1.5 mL and 2.0 mL tubes.
- Benchtop centrifuge.
- Microplate reader.
Safety warnings
- GOPOD reagent and 20 mM sodium phosphate (pH 6.5) (when prepared according to K-BGLU manual) contain 0.09% (w/v) NaN3 which is poisonous. Wear appropriate PPE when using and dispose of as a hazardous substance (do not pour it down the sink!)
- Take care when incubating samples at 99 °C to prevent burns.
Procedure
Add sample to microcentrifuge tube (2 mL). For white wheat flour (or other samples with low beta glucan content) use ~20 mg. For control flours (barley or oat) and samples with beta glucan content above 0.4% add ~10 mg to tube. Note down the sample weight (it will be used in calculations).
Always include a control sample with known beta glucan content alongside unknown samples to confirm that the assay has worked.
Add 40 µL aqueous ethanol (50%, v/v) to all tubes.
To each tube sequentially: Add 380 µL of 20 mM sodium phosphate buffer (pH 6.5). Vortex quickly and proceed to next step immediately.
Place tube in thermal mixer at 99 °C for 3 minutes at 1400 rpm. Ensure all tubes are incubated at least 3 minutes (tubes processed first might experience slightly longer incubation times; this doesn't seem to affect quantification).
Equilibrate the tubes at 50°C for 5 minutes.
Add lichenase (20 µL, 1U) and incubate at 50 °C for 1 hour at 700 rpm.
The standard curve can be prepared here (see section below; once prepared, proceed with step 13 for the standard curve while proceeding with step 7 for samples).
Remove all tubes from thermal mixer and add 500 µL of 200 mM sodium acetate (pH 4.0). Vortex immediately after addition of sodium acetate.
Equilibrate to room temperature (5 minutes).
Centrifuge for 10 minutes at 5000 g.
Dispense 10 µL into four new tubes (1.5 mL volume tubes).
Add 10 µL beta-glucosidase (20 mU) to two of the tubes ('test'). Add 10 µL of 50 mM acetate buffer (pH 4.0) to the other two ('control').
Incubate all tubes at 50°C for 10 minutes at 700 rpm.
Add 300 µL GOPOD reagent to each tube (samples and D-glucose standards) and incubate at 50 °C for 20 minutes with intermittent shaking (shake for 10 seconds every minute at 700 rpm).
Transfer 290 µL of reaction solution to a flat-bottomed 96-well microplate and measure the absorbance at 510 nm against reagent blank within 1 hour.
Standard Preparation
Prepare standards in duplicate in 1.5 mL microcentrifuge tubes according to the table below. Prepare 0 µg D-glucose blanks in quadruplicate if possible. The 1.25 µg data point can be omitted if samples have higher beta glucan content.
| D-glucose (µg) | Standard (µL) | Water (µL) | 50 mM sodium acetate (µL) | |
| 0 | 0 | 10 | 10 | |
| 1.25 | 1.25 | 8.75 | 10 | |
| 2.5 | 2.5 | 7.5 | 10 | |
| 5 | 5 | 5 | 10 | |
| 7.5 | 7.5 | 2.5 | 10 | |
| 10 | 10 | 0 | 10 |
Acknowledgements
Rothamsted Research receives strategic funding from the Biotechnology and Biological Sciences Research Council (BBSRC). The author is funded under the Delivering Sustainable Wheat (BB/X011003/1) Institute Strategic Programme.