Jun 03, 2025
Methods for the study of membrane physiology, synaptics, immunohistochemistry, morphology and ultrastructure of intrinsic cardiac neurons from humans, mice, and pigs
- 1Department of Medicine - Cardiology, David Geffen School of Medicine, University of California, Los Angeles, CA, USA.;
- 2Department of Biomedical Sciences, Quillen College of Medicine, East Tennessee State University, Johnson City, TN, USA.;
- 3Departments of Neurology and Neuroscience, Icahn School of Medicine at Mount Sinai, New York, NY, USA.
- SPARCTech. support email: [email protected]


Protocol Citation: John D Tompkins, Donald Hoover, Leif Havton 2025. Methods for the study of membrane physiology, synaptics, immunohistochemistry, morphology and ultrastructure of intrinsic cardiac neurons from humans, mice, and pigs. protocols.io https://dx.doi.org/10.17504/protocols.io.3byl4998zgo5/v1
Manuscript citation:
Tompkins JD, Hoover DB, Havton LA, Patel JC, Cho Y, Smith EH, Biscola NP, Ajijola OA, Shivkumar K, Ardell JL. Comparative specialization of intrinsic cardiac neurons in humans, mice and pigs. J Physiol. 2024 Nov 8. doi: 10.1113/JP286714. Epub ahead of print. PMID: 39513933.
License: This is an open access protocol distributed under the terms of the Creative Commons Attribution License, which permits unrestricted use, distribution, and reproduction in any medium, provided the original author and source are credited
Protocol status: In development
We are still developing and optimizing this protocol
Created: June 04, 2024
Last Modified: June 03, 2025
Protocol Integer ID: 101217
Keywords: intracardiac ganglia, autonomic nervous system, human, postganglionic, parasympathetic, cardiovascular, ultrastructure of intrinsic cardiac neuron, intrinsic cardiac neuron, membrane physiology, detailed cellular comparison of the structure, neurophysiology, ultrastructure of these cell, intracellular microelectrode recording, cell, human icn, immunohistochemistry, function of icn, detailed cellular comparison, neuron
Funders Acknowledgements:
National Institutes of Health Common Fund SPARC Program
Grant ID: OT2 OD023848
National Institutes of Health Common Fund SPARC Program
Grant ID: OT2 OD026585
Abstract
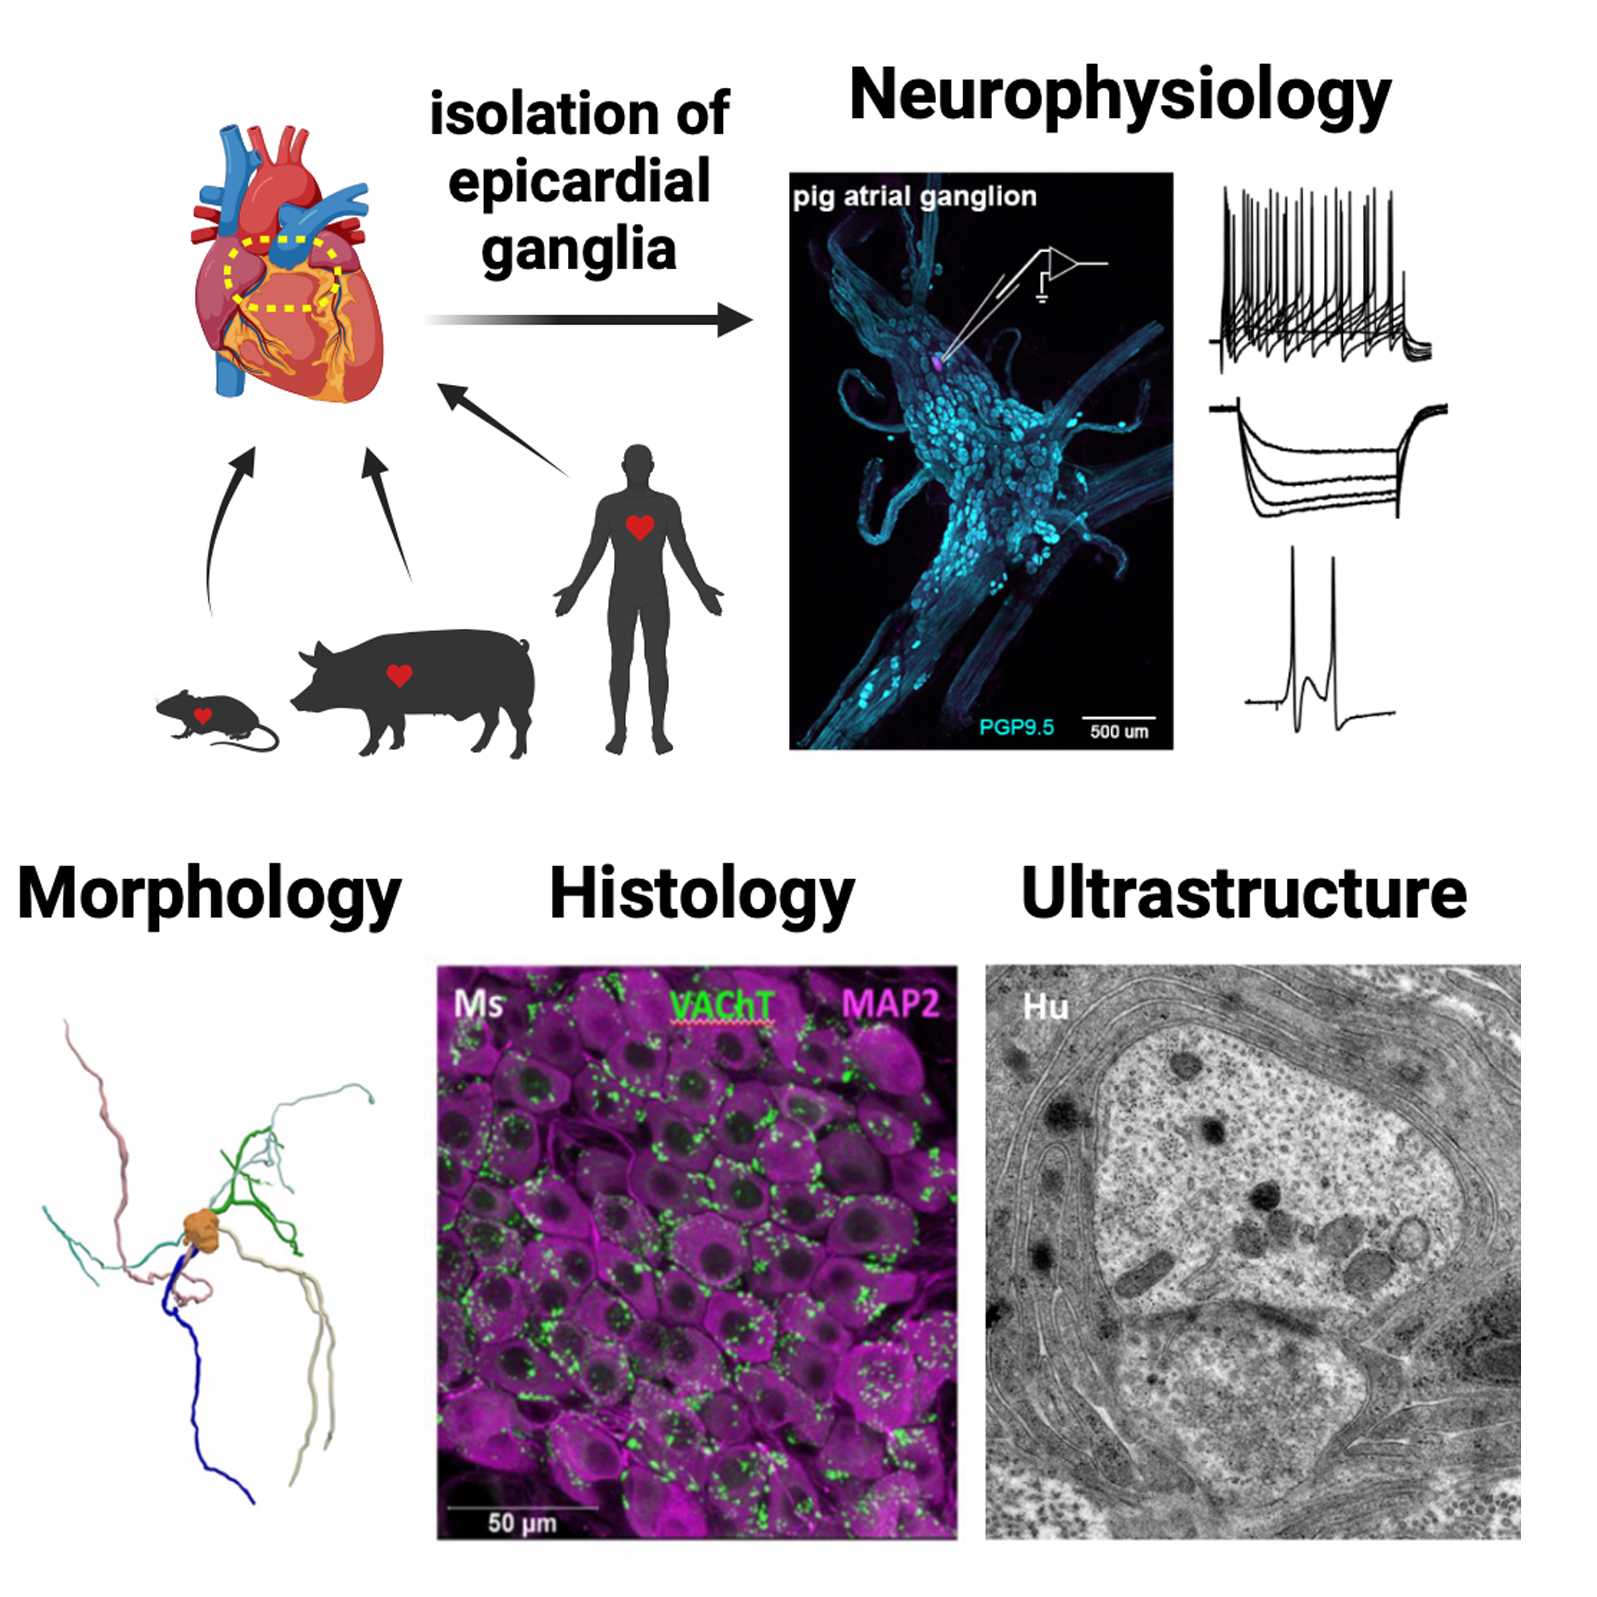
Intrinsic cardiac neurons (ICNs) play a crucial role in the proper functioning of the heart; yet a paucity of data pertaining to human ICNs exists. We took a multidisciplinary approach to complete a detailed cellular comparison of the structure and function of ICNs from mice, pigs, and humans. Immunohistochemistry of whole and sectioned ganglia, transmission electron microscopy, intracellular microelectrode recording and dye filling for quantitative morphometry were used to define the neurophysiology, histochemistry, and ultrastructure of these cells across species. Here described are the extended methodology for these experiments to accompany the published manuscript and dataset. https://doi.org/10.26275/6hdr-oe0p
Materials
Animals:
- C57BL/6J mouse - Jackson Labs, RRID:IMSR_JAX:000664
- Yucatan minipig - Premier Biosource, RRID:NSRRC_0012
Isolation of epicardial ganglia
- SylGard - Dow Corning
- glass-bottom petri dish
- stereo microscope
For mouse and Yucatan minipig hearts:
Physiological salt solution (PSS) containing (in mM):
- 121 NaCl, 5.9 KCl,
- 1.2 NaH2PO4,
- 1.2 MgCl2,
- 25 NaHCO3,
- 2 CaCl2,
- 8 D-glucose.
* pH 7.4 maintained by 95% O2 - 5% CO2 aeration
For human donor hearts:
Crystalloid cardioplegia (University of Wisconsin solution)
Intracellular microelectrode recording
physiological salt solution
neurobiotin tracer - Vector Labs, cat. #: SP-1120
upright compound microscope - Zeiss AxioExaminer
borosilicate glass microelectrodes
Multiclamp 700B amplifier - Molecular Devices, Sunnyvale, CA
Digidata 1550B analog-to-digital converter - Molecular Devices, Sunnyvale, CA
pCLAMP software (Version 10) - Molecular Devices, Sunnyvale, CA
Extracellular stimulation of synaptic potentials
concentric bipolar microelectrodes - FHC, Bowdoin, ME
AMPI Master 8 and IsoFlex optical Stimulus IsolationUnit
MiniAnalysis software - Synaptosoft, Inc., Decatur, GA
Fixation and IHC of whole ganglia
4% paraformaldehyde
Phosphate buffered saline (PBS)
PBS with 0.02% sodium azide
Triton X-100
horse serum
Citifluor (Anti-fade media) - Electron Microscopy Sciences, Hatfield, PA
Primary antibodies
| A | B | C | D | E | |
| Antibody | Concentration | Source | Catalog number | RRID | |
| Rabbit anti-PGP9.5 | 1:500 | Abcam | ab108986 | RID:AB_10891773 | |
| Sheep anti-TH | 1:200 | Millipore | AB1542 | RID:AB_90755 | |
| Rabbit anti-VAChT | 1:500 | Synaptic Systems | 139 103 | RRID:AB_887864 | |
| Goat-anti-nNOS | 1:1000 | Abcam | ab1376 | RRID:AB_300614 | |
| Rabbit anti-SP | 1:1000 | ImmunoStar | 20064 | RRID:AB_572266 | |
| Mouse anti-CGRP | 1:1000 | Abcam | ab81887 | RRID:AB_1658411 | |
| Rabbit anti-NPY | 1:1000 | ImmunoStar | 22940 | RRID:AB_2307354 | |
| Rabbit anti-VIP | 1:1000 | ImmunoStar | 20077 | RRID:AB_572270 |
Table 1
Secondary antibodies
| A | B | C | D | E | |
| Antibody | Concentration | Source | Catalog number | RRID | |
| Donkey anti-mouseAlexa Fluor 594 | 1:200 | Jackson ImmunoResearch Labs | 715-585-150 | RRID:AB_2340854 | |
| Donkey anti-rabbit Cy3 | 1:200 | Jackson ImmunoResearch Labs | 711-165-152 | RRID:AB_2307443 | |
| Donkey anti-sheep 488 | 1:200 | Jackson ImmunoResearch Labs | 713-545-147 | RRID:AB_2340745 | |
| Donkey anti-mouse Cy3 | 1:200 | Jackson ImmunoResearch Labs | 715-005-150 | RRID:AB_2340758 | |
| Streptavidin conjugatedATTO-647N | 1:500 | Sigma-Aldrich | 94149 |
Table 2
Confocal imaging of whole ganglia
confocal microscope - Zeiss LSM880, RRID:SCR_020925
Quantification of neuron morphology
ImageJ (Fiji distribution) - RRID:SCR_002285
Neurolucida 360 - MBF Bioscience, RRID:SCR_016788
Neurolucida Explorer - MBF Bioscience, RRID:SCR_017348
Transmission electron microscopy
2% paraformaldehyde
2.5% glutaraldehyde
0.12 mol/L Millonigs buffer
Double-distilled water (ddH2O)
1% osmium solution
Ethanol
Propylene oxide
1% toluidine blue solution
Uranyl acetate
Lead citrate
Plastic resin - Epon, Ted Pella
Light microscope - Nikon Eclipse E600 with Nikon DS-Fi3 camera
formvar-coated grids - Ted Pella
FEI-Tecnai G2 Spirit Twin transmission electron microscope - ThermoFisher Scientific
Orius SC1000 CCD camera - Gatan, Inc
SerialEM - RRID:SCR_017293
Isolation of epicardial ganglia from mice
Adult C57BL/6J (Jackson Labs, RRID:IMSR_JAX:000664) mice (age 10 ± 2 wks) were anesthetized deeply with isoflurane (5%) and exsanguinated.
The thoracic cavity, including ribs, heart, and lungs, was removed and placed in ice-cold physiologic salt solution (PSS) containing (in mM): 121 NaCl, 5.9 KCl, 1.2 NaH2PO4, 1.2 MgCl2, 25 NaHCO3, 2 CaCl2, 8 D-glucose; pH 7.4 maintained by 95% O2 - 5% CO2 aeration.
The heart was removed from the thorax and observed beneath a stereo microscope to isolate epicardial ganglia by fine dissection.
Connective tissue enveloping isolated ganglia, which were devoid of any contracting myocardium, was pinned to the SylGard (Dow Corning) floor of a glass bottom petri dish.
Isolation of epicardial ganglia from Yucatan pigs
Adult Yucatan minipigs (Premier Biosource, RRID:NSRRC_0012), age 6 to 8 mo, were sedated with intramuscular telazol (4–6 mg/kg), intubated, and mechanically ventilated.
General anesthesia was maintained with inhaled isoflurane (1.5–2.5%) and intravenous boluses of fentanyl (total: 10–30 µg/kg) during surgical preparation of a median sternotomy to expose the heart.
Major vessels were clamped, the heart was removed, rinsed in PSS, and the dorsal right atrium, at the junction of the superior vena cava (SVC) and the inferior vena cava (IVC), was dissected for subsequent dissection of epicardial ganglia beneath a stereo microscope.
Isolation of epicardial ganglia from human donor hearts
Human hearts (aged 40 to 72yrs) were procured from deceased organ donors following formal declarations of brain death.
The hearts were transported in ice cold crystalloid cardioplegia (University of Wisconsin solution) and were received within six hours of aortic cross clamp.
A portion of the posterior right atrium containing the RAGP was excised and epicardial ganglia were isolated under a stereo microscope by fine dissection.
The isolated ganglia were pinned to the SylGard floor of a glass bottom petri dishes using methods like those for pig and mouse ganglia.
Intracellular microelectrode recording
Isolated ganglion preparations were transferred to the stage of an upright microscope (Zeiss AxioExaminer) equipped with differential interference contrast optics, an Axiocam camera, and a 5X air and a 40X water-immersion objective.
Ganglia were superfused (6-7 ml/min) continuously with PSS maintained at 34 ± 2 C.
Visually identified neurons were impaled with borosilicate glass microelectrodes filled with 2% neurobiotin (Vector Labs, Burlingame, CA) in 2.0 M KCl.
Electrode tip resistances measured between 60 and 120 MΩ.
Recordings of membrane potential were made with a Multiclamp 700B amplifier (Molecular Devices, Sunnyvale, CA) in current clamp mode.
Data was acquired using a Digidata 1550B (Molecular Devices) analog-to-digital converter. The amplifier and data acquisition were controlled with pCLAMP software (Version 10, Molecular Devices).
Depolarizing and hyperpolarizing currents were injected through the recording electrode to determine responsiveness of the neuronal membrane.
Hyperpolarizing current steps (500 ms duration; -50 to -500 pA) were used to measure whole cell input resistance and the membrane time constant (tau). Tau was measured by a single exponential fit to the membrane potential change in response to a hyperpolarizing current (-50 or -100 pA).
The instantaneous and steady-state membrane potential changes in response to both hyperpolarizing and depolarizing currents were measured.
Depolarizing current steps (500 ms duration) of increasing intensity were used to assess membrane excitability.
Excitability curves were produced by plotting the number of action potentials evoked by the depolarizing current steps.
Cells were classified as either phasic (firing ≤4 spikes) or tonic (firing >4 spikes continuously) based on the number of action potentials evoked by long-duration, supramaximal depolarizing currents (500 ms).
The amplitude and duration of the action potential upstroke were measured from spontaneous or nerve evoked action potentials.
The amplitude and duration of the after-hyperpolarizing potential was measured from action potentials evoked by brief intracellular current injection (5 ms duration).
In total, resting membrane potential, rheobase, whole cell input resistance, tau, AP 1/2 width, AP duration, AHP amplitude, 2/3rds AHP duration were measured.
Extracellular stimulation of synaptic potentials
Synaptic potentials were evoked within the intact ganglion preparations by focal stimulation of interganglionic nerves using extracellular, concentric bipolar electrodes (FHC; Bowdoin, ME).
Graded shocks (50-800 uA; 100 µs) were delivered by an AMPI Master 8 and IsoFlex optical Stimulus Isolation Unit.
Stimulus recruitment curves were generated by plotting the latency of the evoked potential against the stimulus current.
Five to 20 stimuli were delivered at each stimulus intensity, at an interval of three seconds between stimuli.
Latency was calculated from the onset of the command pulse to the upstroke of the evoked potential.
Trains of stimuli were given at 5, 10, or 20 Hz to assess spike following frequency at the post-synaptic neuron.
The amplitudes of spontaneous excitatory post-synaptic potentials (sEPSPs) were quantified using MiniAnalysis software (Synaptosoft, Inc.).
In total, latency, spike following frequency, and sEPSP amplitude were measured.
Fixation and IHC of whole ganglia
Ganglia were fixed by overnight (12hr) immersion in 4% paraformaldehyde at 4 oC, then rinsed
in phosphate buffered saline (PBS) and stored in PBS + 0.02% sodium azide at 4 oC
until subsequent immunohistochemical processing.
For immunostaining of ganglion whole mounts, ganglia were blocked in 0.01M PBS, 0.02% sodium azide, 0.1% Triton X-100, and horse serum for four hours at room temperature with agitation.
The ganglia were then incubated in primary antibodies, in a solution of 0.01M PBS, 0.02% sodium azide, and 0.1% TritonX-100, with agitation over two nights.
Ganglia were rinsed in a solution of 0.01M PBS, 0.02% sodium azide (1hr rinse, 3 rinses) and incubated in secondary antibodies, diluted in 0.01M PBS with 0.1% Triton X-100 and 0.02% sodium azide, over 48 hours at room temperature with agitation.
Stained tissue received a final rinse in 0.01M PBS, 0.02% sodium azide (1hr rinse, 3 rinses) and was mounted on glass slides in anti-fade media (Citifluor CFM-1 plus AF, Electron Microscopy Sciences) and coverslipped.
Confocal imaging of whole ganglia
Whole ganglia were imaged with a confocal microscope (Zeiss LSM880) by tile-scanning in X, Y, and Z planes using a 63X objective (Zeiss Plan-Apo, 1.4NA).
Z-stack images were acquired at step sizes consistent with Nyquist sampling in relation to the numerical aperture of the objective.
Sectioned ganglion IHC
Tissue blocks of the RAGP fat pad were frozen on dry ice and stored at −80°C until sectioning. Blocks were attached to specimen plates, cut at −20 to −25°C using a Leica CM3050S cryostat (Leica Microsystems Inc., Wetzlar, Germany), and 30 μm thick sections were collected on adhesion slides.
Tissues were sectioned in a plane parallel to the epicardial surface, and sections were collected in a sequence that yielded eight sets of sections that each spanned the entire thickness of the specimen.
Each set of tissue sections was stored at −20°C until further processing.
Slide-mounted tissue sections were immunostained at room temperature for markers using standard methods of fluorescence immunohistochemistry (IHC).
Briefly, slides were rinsed with 0.01 mol/L PBS (pH 7.3), incubated for 10 min in 0.01 mol/L PBS containing 0.4% Triton X-100 and 0.5% bovine serum albumin (BSA), and blocked for 2 h in 0.01 mol/L PBS containing 1% BSA, 0.4% Triton X-100 and 10% normal donkey serum (Jackson ImmunoResearch Laboratories, West Grove, PA, USA).
Each section was then incubated overnight in blocking buffer containing one or more of the primary antibodies listed in Table 1 in the Materials section.
Sections were washed again and incubated in blocking buffer before application of secondary antibodies.
Species-specific donkey secondary antibodies conjugated to Alexa Fluor 488, 555, 594 or 647 (Jackson ImmunoResearch Laboratories) were applied at a 1:200 dilution in 0.01 mol/L PBS containing 0.4% Triton X-100 and 1% BSA, and sections were incubated for 2 h before final washing in 0.01 mol/L PBS.
After final washes with 0.01 mol/L PBS, cover glasses were applied with Citifluor (Ted Pella, Inc., Redding, CA, USA) or SlowFade Gold antifade reagent (Life Technologies Corp., Carlsbad, CA, USA).
Confocal Imaging of Sectioned Ganglia
Slides were viewed under fluorescence illumination with an Olympus BX41 microscope equipped with an Olympus DP74 digital camera and cellSens software (Olympus America Inc., Center Valley, PA, USA RRID:SCR_01 6238).
After localizing ganglia within sections, they were evaluated with a Leica TCS SP8 confocal microscope with 10×, 20× and 40× objective lenses (Leica Microsystems Inc.).
Confocal images were collected at a resolution of 1024 × 1024 using 488 and 552 nm laser lines.
Stacks spanned tissue thicknesses of 25–33 μm unless otherwise noted.
Figures were created using maximum intensity projection (MIP) images for individual channels and merged images.
Quantification of neuron morphology
Images were quantified using ImageJ to measure neuronal cross-sectional areas (measured at Z-plane containing nucleus), and total cell counts per ganglia were quantified with ImageJ (FIJI distribution).
Quantification of neuron morphology
Neurobiotin filled neurons were serially imaged to visualize cell structure.
Neuronal structures were segmented, and quantified, using Neurolucida 360 and Neurolucida Explorer (MBF Bioscience).
The file format of the traced structures was converted from .dat to .swc using HBP Neuron Morphology Viewer (Bakker et al., 2017).
SWC files were quantified using the ImageJ plugin SNT (Arshadi et al., 2021).
Quantified values include: cell soma and dendrite area in X, Y and Z planes, soma volume, number of dendrite stems (originating branches from soma), number of dendrite bifurcations, number of dendrite branches, number of dendrite tips, total dendrite length, mean dendrite length, total dendrite surface area, total dendrite volume.
Transmission electron microscopy
Samples of whole-mount right atrial ganglion plexi (RAGPs) intended for electron microscopy (EM) analysis were carefully isolated from the heart using a dissection microscope and then submerged in a solution containing 2% paraformaldehyde (PFA) and 2.5% glutaraldehyde overnight at 4°C in a 0.12 mol/L
Millonigs buffer (MB).
After thorough washing with Millonigs buffer and double-distilled water (ddH2O), the tissues underwent fixation in a 1% osmium solution diluted in ddH2O, followed by a series of ethanol (EtOH) and propylene oxide dehydration steps.
Subsequently, the tissues were embedded in a plastic resin (Epon, Ted Pella).
Semi-thin cross-sections (0.5 μm thick) were prepared and stained with a 1% toluidine blue solution diluted in ddH2O to enable a general overview of RAGP organization under a light microscope (Nikon Eclipse E600 microscope equipped with a Nikon DS-Fi3 camera).
Ultra-thin sections (70 nm thickness) were then mounted onto formvar-coated grids (Ted Pella), stained with uranyl acetate and lead citrate for contrast enhancement, and examined in a Tecnai G2 Spirit Twin transmission electron microscope (FEI, ThermoFisher Scientific) operating at 80 kV.
Images were captured using a Gatan Orius SC 1000B digital camera (Gatan) and SerialEM software (Schorb et al., 2019).
Protocol references
Tompkins JD, Hoover DB, Havton LA, Patel JC, Cho Y, Smith EH, Biscola NP, Ajijola OA, Shivkumar K, Ardell JL. Comparative specialization of intrinsic cardiac neurons in humans, mice, and pigs. bioRxiv [Preprint]. 2024 Apr 8:2024.04.04.588174. doi: 10.1101/2024.04.04.588174. PMID: 38645175; PMCID: PMC11030249.
Bakker R and Tiesinga P. HBP neuron morphology viewer [version 1; not peer reviewed]. F1000Research 2016, 5:2282 (poster) (https://doi.org/10.7490/f1000research.1113110.1)
Arshadi, C., Günther, U., Eddison, M. et al. SNT: a unifying toolbox for quantification of neuronal anatomy. Nat Methods 18, 374–377 (2021). https://doi.org/10.1038/s41592-021-01105-7
Schorb, M., Haberbosch, I., Hagen, W.J.H. et al. Software tools for automated transmission electron microscopy. Nat Methods 16, 471–477 (2019). https://doi.org/10.1038/s41592-019-0396-9