Dec 24, 2025
Version 2
Machine learning-based phylogenetic analysis using Covary V.2
- Marvin De los Santos1
- 1ChordexBio



Protocol Citation: Marvin De los Santos 2025. Machine learning-based phylogenetic analysis using Covary. protocols.io https://dx.doi.org/10.17504/protocols.io.n92ld13p8l5b/v2Version created by Marvin De los Santos
Manuscript citation:
https://doi.org/10.1101/2025.11.13.687960
License: This is an open access protocol distributed under the terms of the Creative Commons Attribution License, which permits unrestricted use, distribution, and reproduction in any medium, provided the original author and source are credited
Protocol status: Working
We use this protocol and it's working
Created: December 23, 2025
Last Modified: December 24, 2025
Protocol Integer ID: 235746
Keywords: Machine learning phylogenetics, alignment-free phylogeny, sequence embedding, Covary, deep learning, species identification, gene tree reconstruction, 16S rRNA, 18S rRNA, vector embeddings, clustering-based phylogeny, outgroup detection, taxonomic placement, large-scale genomic analysis, reproducible bioinformatics, Google Colab workflows, phylogenetic analysis, based phylogenetic analysis, phylogenetic inference, scale phylogenetic analysis, covary, operational workflow of covary, covary this protocol, tree reconstruction, sequence data, using covary, methodical operations of covary, statistical tool, other python, training data, other downstream visualization
Disclaimer
Your usage of different Covary versions, Covary-encoder, TIPs-VF and other components of the Covary suite may be limited. Please refer to the license notice at https://github.com/mahvin92/Covary?tab=License-1-ov-file for your review. If you implement Covary using a Colab notebook, please ensure to comply with Google’s Terms of Service. Note that this protocol was tested on Covary v2.1 using a computational performance on a free-tier subscription in Google Colab. Covary is provided "as is", without warranty of any kind, express or implied. For more information, please visit https://covary.chordexbio.com or read our paper at https://doi.org/10.1101/2025.11.13.687960.
Abstract
This protocol describes the operational workflow of Covary, a machine learning-based framework for large-scale phylogenetic analysis and species identification. This protocol enables users to perform phylogenetic inference directly from sequence data without requiring coding experience or local software installation. The workflow is applicable to v2.1 of Covary and accepts multi-FASTA sequence files as input (or training data) and provides configurable parameters for encoding, neural network inference, and downstream analysis.
Covary is designed to scale to thousands of sequences and produces interoperable outputs compatible with Matplotlib and other python-based libraries, R, and other downstream visualization and statistical tools. The protocol is optimized for execution in a Google Colab environment, eliminating software maintenance and platform dependency.
This protocol focuses on the methodical operations of Covary for tree reconstruction and species identification. Covary is available at https://github.com/mahvin92/Covary.
Protocol Introduction
This protocol documents the use of Covary for the following analytic workflow in phylogenetics:
- Tree reconstruction
- Species identification
- Taxonomic placement
The scope of this protocol is limited to tree inference and species-level classification using marker-based sequences (16s and 18s rRNA markers), as demonstrated previously (De los Santos, 2025a). While Covary supports broader analytical workflows (e.g., genome-scale), those extensions are outside the scope of this protocol.
This protocol is designed to be performed using Covary v2.1 on Google Colab (Figure 1).
Figure 1. Covary v2.1 interface on Google Colab.
Overview of Covary
Covary consists of two core computational components:
- Covary-encoder: A proprietary genetic encoding logic that transforms nucleotide sequences into numerical representations suitable for machine learning. This encoding captures compositional and positional properties of biological sequences without relying on traditional multiple sequence alignment. The Covary-encoder was built using the Translator-Interpreter Pre-seeding for Variable-length Fragment (TIPs-VF) designed for augmenting the vector-based representation of variable-length DNA fragments with sequence, length, and positional awareness (De los Santos, 2025b).
- Covary Neural Network: The encoded representations are processed using a deep learning model adapted from Keras. The network performs similarity learning and scoring, enabling clustering, tree reconstruction, and species-level inference.
The Covary workflow includes the following steps:
- Set parameters: Runs the default configurations or modified parameters set by the user.
- Upload your data ‱: Responsible for importing/uploading your data to the Colab/Jupyter environment.
- Install dependencies: Automatically lists, installs, and verifies all required Python libraries and runtime dependencies needed to execute Covary.
- Quality control (QC) check: Validates input sequences for format consistency, nucleotide composition, and basic integrity prior to encoding.
- Covary encoding ‱: Transforms validated biological sequences into numerical vector representations using the Covary-encoder.
- Deep learning inference: Applies the Covary neural network to the encoded vectors to compute similarity relationships and latent representations.
- Scoring and analysis: Generates similarity scores, distance matrices, clustering outputs, and intermediate analytical results used for tree reconstruction and species identification.
- Download results ‱: Exports all generated outputs, including matrices, embeddings, plots, and auxiliary files, for downstream analysis and visualization.
‱ Important: Steps marked with ‱ may require user input or active attention. These fields should not be collapsed while running Covary.
In Step 2, users must upload a multi-FASTA file containing all sequences to be analyzed as shown in Figure 2 below.
Figure 2. Uploading your data on Covary in Step 2.
Preparing Your Data
Compile your data in a multi-FASTA formatted file (recommended file type as .fasta). Note: Download or obtain your data ONLY from credible sources like NCBI or EMBL.
For the purpose of this exercise, you can download the pre-compiled dataset for 16s rRNA analysis and tree reconstruction using 18s rRNA sequences.
Dataset
Staphylococcus spp. 16s rRNA sequences (SARS-CoV-2 as outgroup)
NAME
Dataset
Mammalian 18s rRNA sequences
NAME
If you are generating and compiling your own sequences, ensure to format your data in a multi-FASTA format.
>NR_181868.1 Thermus brevis strain SYSU G05001 16S ribosomal RNA, partial sequence
GACATGCAAGTCGAGCGGGGCGGGTTTATACCTGCCCAGCGGCGGACGGGTGAGTAACGC
GTGGGTGACCTACCTGGAAGAGGCGGACAACCTGGGGAAACCCAGGCTAATCCGCCATGT
GGTCCTGTCCTGTGGGGCAGGACTAAAGGGTGGATAGCCCGCTTCCGGATGGGCCCGCGT
CCCATCAGCTAGTTGGTGGGGTAAGAGCCCACCAAGGCGACGACGGGTAGCCGGTCTGAG
>NR_181790.1 Thermus brevis strain SYSU G05001 16S ribosomal RNA, partial sequence
GACATGCAAGTCGAGCGGGGCGGGTTTATACCTGCCCAGCGGCGGACGGGTGAGTAACGC
GTGGGTGACCTACCTGGAAGAGGCGGACAACCTGGGGAAACCCAGGCTAATCCGCCATGT
GGTCCTGTCCTGTGGGGCAGGACTAAAGGGTGGATAGCCCGCTTCCGGATGGGCCCGCGT
CCCATCAGCTAGTTGGTGGGGTAAGAGCCCACCAAGGCGACGACGGGTAGCCGGTCTGAG
>NR_180714.1 Thermus sediminis strain L198 16S ribosomal RNA, partial sequence
GACATGCAAGTCGTGCGGGCCGTGGGGTTTCTCACGGCTAGCGGCGGACGGGTGAGTAAC
GCGTGGGTGACCTACCCGGAAGAGGGGGACAACCTGGGGAAACCCAGGCTAATCCCCCAT
GTGGACGCATCCTGTGGGGTGCGTTCAAAGGGCGTTGCCCGCTTCCGGATGGGCCCGCGT
CCCATCAGCCAGTTGGTGGGGTAAAGGCCCACCAAGGCGACGACGGGTAGCCGGTCTGAG
Perform quality check on your sequences and align your research objectives with your sequence types/formats (if any). Note: Covary allows you to perform multi-parallel sequence comparison, eliminating the need for concatenation and sequence coalescence if you are performing phylogenomics or multi-marker studies. However, aligning your research objective with your data types should come as the priority.
When necessary, remove or correct non-accepted characters prior to analysis. Alternatively, you can use the 'clean_seq.py' implementation on TIPs-VF to seamlessly perform this task, available at https://github.com/mahvin92/TIPs-VF/tree/main/pre-processing
Ensure nucleotide bases are fully resolved (avoid ambiguous bases when possible). Resolve your sequences using a reference seq/genome/assembly, if there is a need to.
Pre-alignment or multiple sequence alignment is not necessary and not recommended. However, the performance of Covary can be enhanced if all sequences or group of sequences (in a multi-parallel analysis) would start relatively in a similar position (e.g., TSS or TFBS).
If you can not perform QC on your data, Covary (in Step 4 and Step 5) can be configurable to perform deep quality analysis of your data.
a. By default, Covary will exclude 'sequence entry' in your FASTA file from getting utilized as part of your training dataset, as part of its QC check in Step 4. To change this, change the [include_N = "no"] variable to [include_N = "yes"] in Step 1a.
b. By default, although this feature may no longer be required in the newer iterations of Covary, Step 5 will will identify which sequence entries contain non-A,T,C,G bases. You can then cancel the run, and modify them (if needed).
Pre-run Configuration
Review and configure parameters that control how input sequences are handled during runtime and how results are rendered.
1. Handling of sequence entries with non-A,T,C,G nucleotides: By default, Covary performs strict nucleotide validation and excludes sequences containing non-canonical characters (e.g., N, ambiguous bases) to ensure consistency during encoding and model inference. Note: To override this behavior and allow such sequences to be included in the analysis, update the parameter below.
2. Plot customization: These parameters control figure size, resolution, color themes, label visibility, and layout for embeddings, pairwise distance heatmaps, and dendrograms. Note: Adjusting these settings does not affect model inference but influences how results are rendered and exported.
Performing an Analysis
Running Covary on your dataset is pretty much straightforward on Google Colab by initiating or connecting to a runtime. Note: Always (if possible) connect to a GPU support (e.g., T4).
Toolbar: Click 'Runtime' --> Select 'Run all'
Upload your data in Step 2 (as shown in Figure 2 )
Code cell: Click 'Browse' --> Find your .fasta file (the ones downladed in ) --> Click 'Open' (or double click) --> Wait for the upload to finish
Wait for the results to be compiled and downloaded on Step 8. If the download does not occur automatically, you can re-run Step 8 or browse to the Covary results folder.
Assess for the completeness of the results, Covary will produce the following:
1. Embedding data (the raw dim-1 and dim-2 of PCA, t-SNE, UMAP projections)
2. Embedding plots (in PCA, t-SNE, UMAP)
3. Euclidean pairwise distances of all embedded vectors (in PCA, t-SNE, UMAP projections)
4. Heatmap plot of the pairwise distances (in PCA, t-SNE, UMAP)
5. Linkage distances of all embedded vectors (raw distances in PCA, t-SNE, UMAP using average, complete, single, and Ward's method)
6. Hierarchical clustering plots or dendrograms (of the different linkages in PCA, t-SNE, UMAP)
Model Output Interpretation
Inspect the pattern of clustering and pairwise distances of the embeddings plots in PCA, t-SNE, and UMAP. Note that a well defined clustering pattern (either superimposition or closed grouping) in the different dimensionality reduction plots and presence of distinct blocks in the heatmaps are indicative of successful comparative sequence representation.
Covary represents the linearity of distances of the embeddings in the vector space as measure of relatedness or feature similarities. Hence, sequences that are more similar may cluster together or are closer together.
For the purpose of this exercise, check that the out-group sequences (SARS-CoV-2 in bacterial 16s rRNA and fungus-derived sequence in mammalian 18s rRNA analyses). The relationship of in-group and outgroup sequences should be apparent in both the embedding and heatmap plots as show in Figure 3 below.
Figure 3. Model assessment of Covary in 16s and 18s rRNA analysis (top and bottom, respectively) by inspecting the embedding plots (left) and the heatmaps (right). The results show that out-group sequences did not cluster or have distances that are far from the in-group sequences, shown by relative positions in the vector embeddings (by PCA, in top left and bottom left) and color distances, where red means had PCA distances metrics farthest from the other groups (top right and bottom right).
Manual Tree Search
Select the appropriate dimensionality reduction model (the best vector space that had the most feature-resolved). Note: PCA, t-SNE, and UMAP projects vector embeddings in different ways and so, the vector distances may vary between the these three methods.
Initial performance optimization of Covary showed that distance matrices derived from PCA were conducive for relationship estimation in sequences with very minimal differences (e.g., point mutations, single nucleotide polymorphism); whereas, t-SNE was found to assist in developing competitive models for deriving relationships in sequences with a minimal degree of complexity (e.g., internally gapped sequences), and UMAP supports estimation with large variability in sequence differences (e.g., fusion genes).
For the purpose of this exercise, PCA will be chosen to use as a model for Manual Tree Search.
Select the appropriate hierarchical method for clustering analysis. Note: Covary performs clustering-wide analysis across complete, average, single, and Ward's methods. Depending on the evolutionary assumptions of the research objectives, users can identify which model works best for tree reconstruction or species clustering.
For the purpose of this exercise, the complete linkage-based clustering will be used for Manual Tree Search.
Select the most appropriate tree for your analysis.
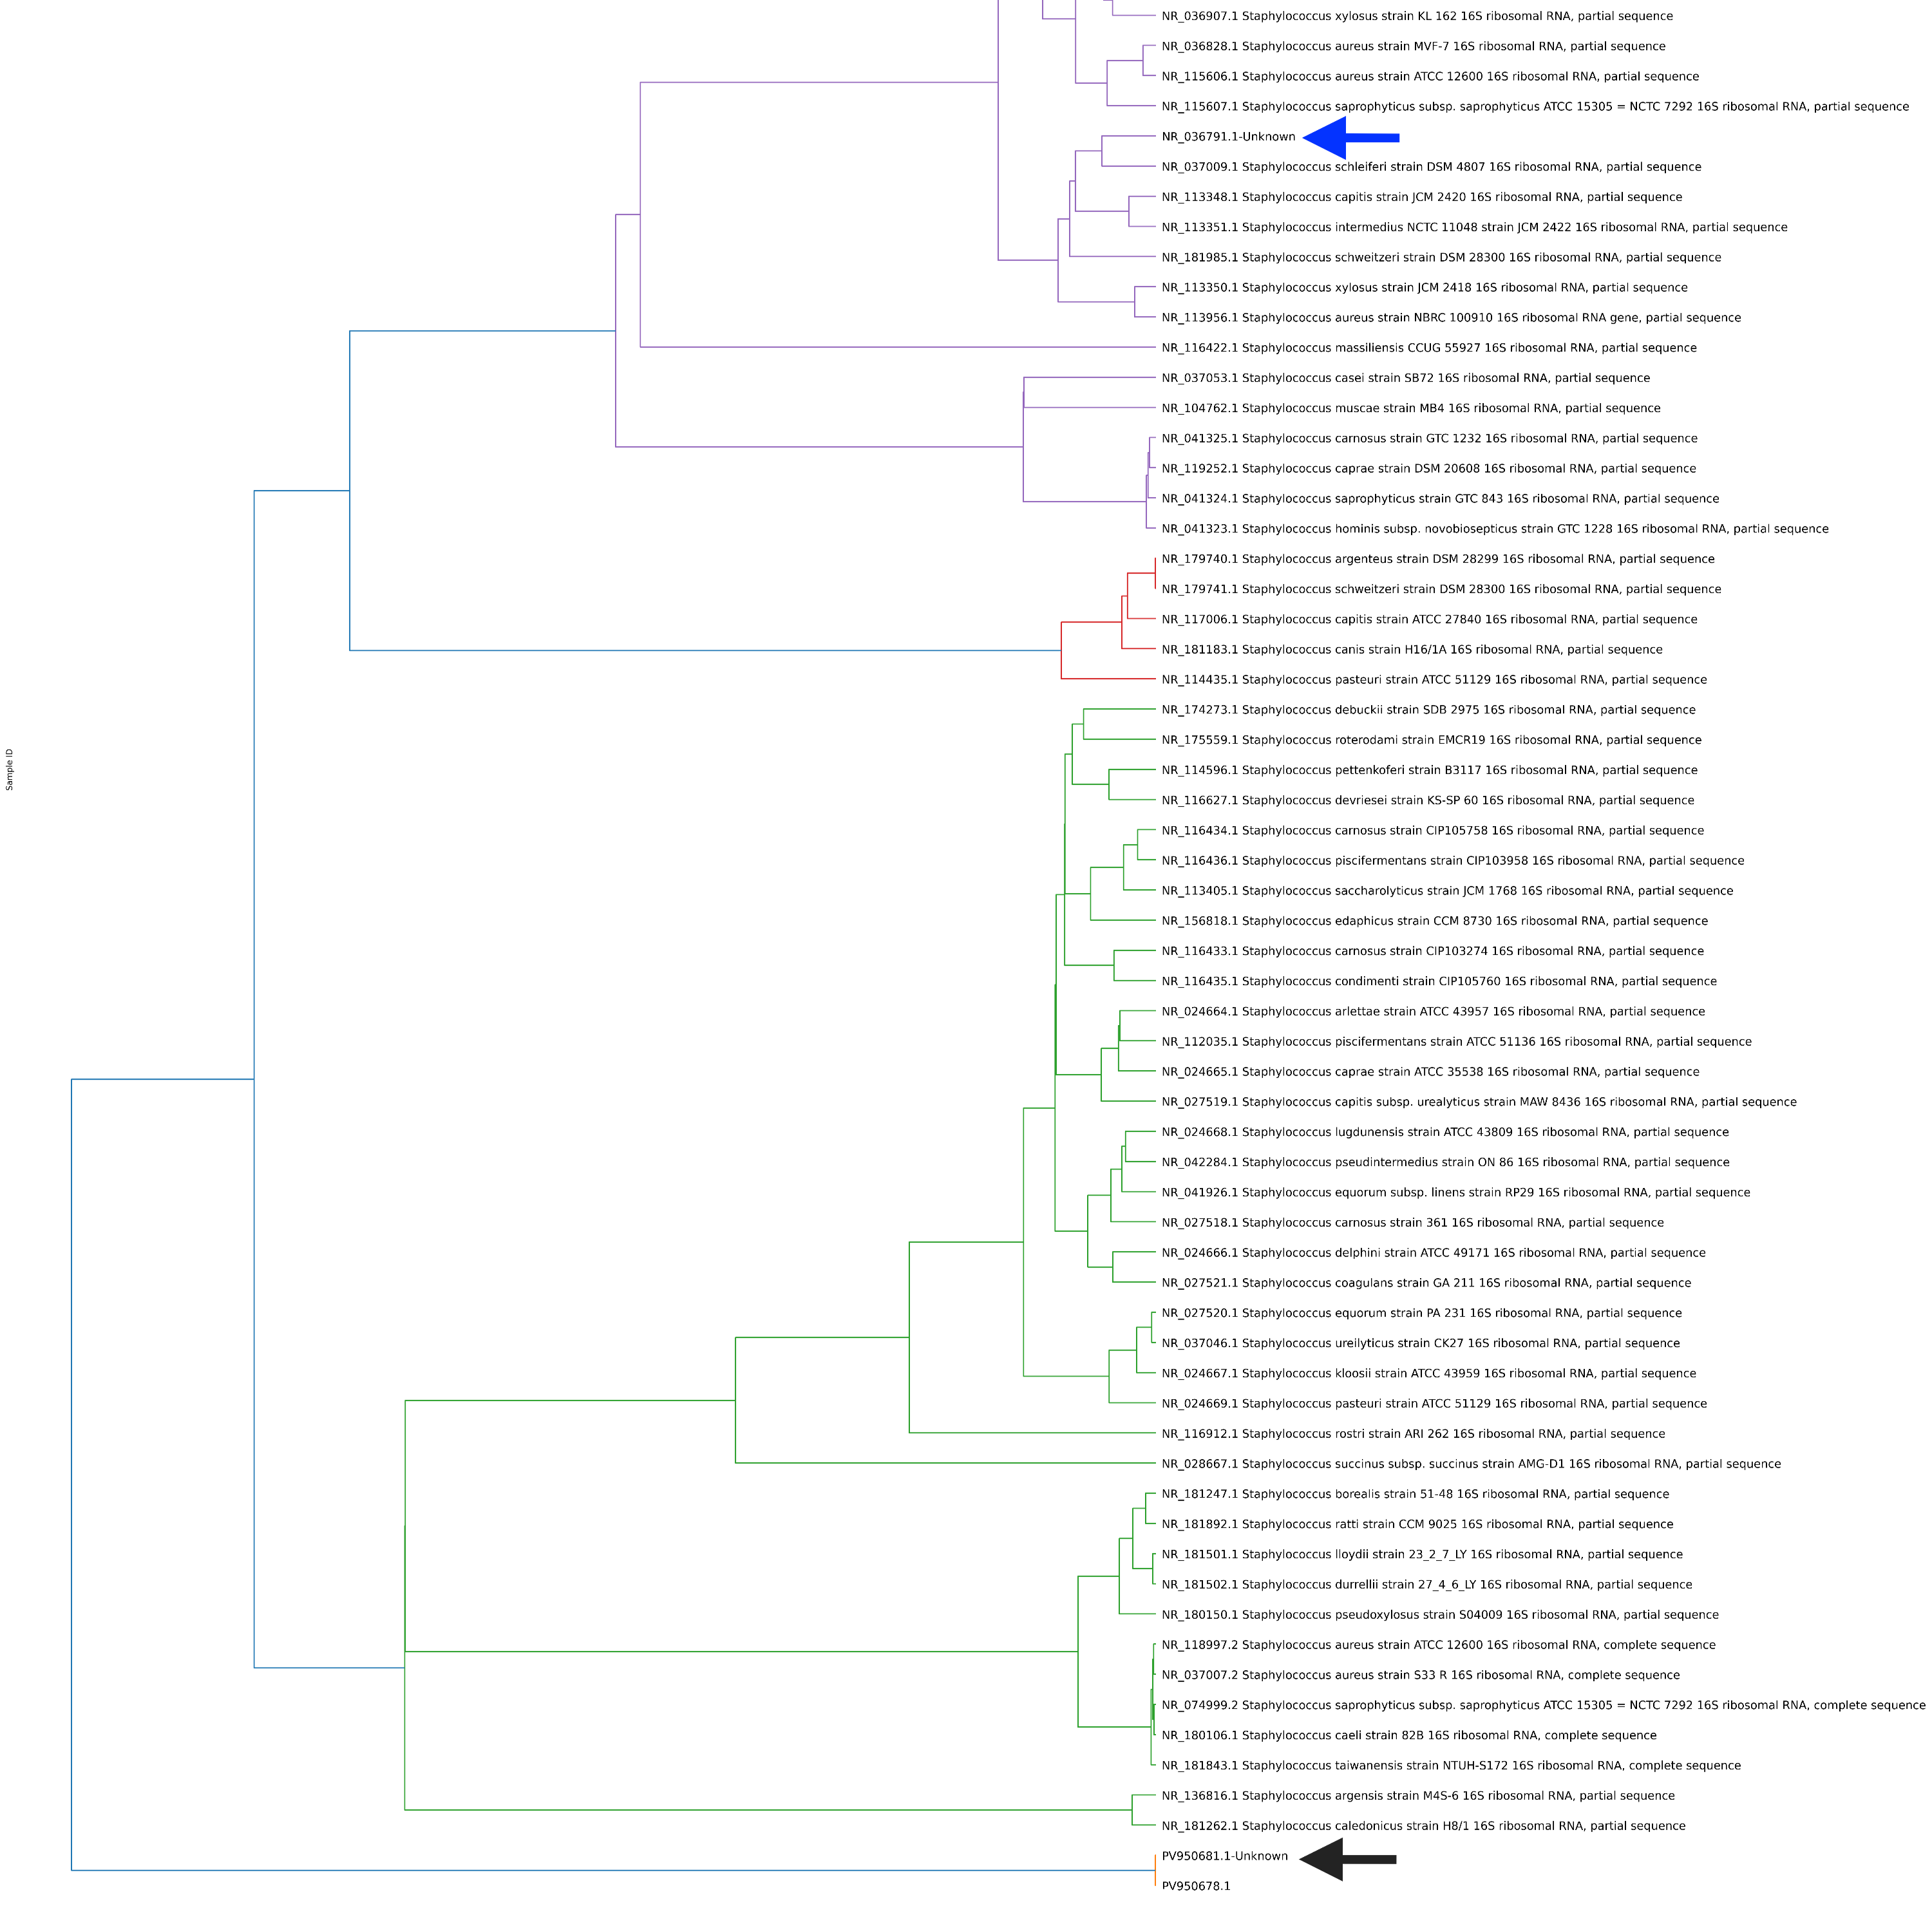
For the purpose of this exercise, the PCA complete-linkage model was used to infere phylogenetic relationship. Results showed that the SARS-CoV-2 sequence (accession number: PV950678.1) was unrelated to the Staphylococcus spp. 16S rRNA sequences. Taxonomic placement of the sequences labeled as unknown by Covary yielded a notable result, where an unknown-labeled SARS-CoV-2 sequence was placed as part of the out-group, as expected, while the unknown-labeled Staphylococcus spp.–derived 16S rRNA sequence was placed in-group with the remaining analyzed Staphylococcus spp. 16S rRNA sequences (Figure 4). Additionally, Covary predicted that the unknown sequence is highly similar to the 16S rRNA gene of Staphylococcus schleiferi strain DSM 4807. These results demonstrate that Covary can infer sequence similarity by clustering taxonomically relevant sequences and placing them within the appropriate taxonomic group, providing a potential resolution for species-level identification.
Figure 4. Result of species identification and out-group/in-group detection using 16s rRNA marker in Covary. The vector embeddings in Covary accurately grouped 16S rRNA sequences by genus (e.g., Staphylococcus), correctly clustered a taxonomy-verified Staphylococcus sequence of unknown label within its expected clade, and positioned viral outgroups (SARS-CoV-2 whole-genome sequences) at distinct boundaries, demonstrating accurate in-group/out-group discrimination. In addition, Covary associated the unknown 16S rRNA sequence in close proximity to Staphylococcus schleiferi strain DSM 4807, supporting species-level identification based on embedding similarity.
Similar model was used to infer the gene tree of 18s rRNA in the mammalian group, with A. niger 18s rRNA, a fungal species, used as out-group control. Covary inferred a topology that separates non-mammalian A. niger as the outgroup and partitions mammals into two major clades: rodents on one side and primates + ungulates on the other (Figure 5). To validate topology consistency, the same tree was reconstructed using the ETE3 toolkit (Huerta-Cepas et al., 2016) and observed concordant grouping, where A. niger sits as outgroup and primates and ungulates associating more closely with each other than either with rodents.
Figure 5. Gene tree reconstruction using the 18S rRNA marker. A) Phylogenetic relationships inferred by Covary, with the tree reconstructed using complete-linkage clustering of vector distances derived from t-SNE embeddings. B) Reference phylogenetic tree generated using ETE3 with default parameters (MAFFT multiple sequence alignment followed by IQ-TREE inference). The 18S rRNA sequence of Aspergillus niger was designated as the outgroup, while mammalian representatives (Rattus norvegicus, Mus musculus, Bos taurus, Gorilla gorilla, Pan troglodytes, and Homo sapiens) were treated as the ingroup. Tree topologies were broadly congruent between Covary and ETE3.