May 27, 2025
Live-Imaging of GCase Activity in iPSC-Derived Dopaminergic Neurons Using the PFB-FDGlu Probe
- Roxanne Larivière1,
- Jace Jones-Tabah1,
- Edward A. Fon1
- 1Montreal Neurological Institute - McGill University


Protocol Citation: Roxanne Larivière, Jace Jones-Tabah, Edward A. Fon 2025. Live-Imaging of GCase Activity in iPSC-Derived Dopaminergic Neurons Using the PFB-FDGlu Probe. protocols.io https://dx.doi.org/10.17504/protocols.io.4r3l2br2jl1y/v1
Manuscript citation:
The Parkinson's disease risk gene cathepsin B promotes fibrillar alpha-synuclein clearance, lysosomal function and glucocerebrosidase activity in dopaminergic neurons, Mol Neurodegener. 2024 Nov 25;19(1):88. doi: 10.1186/s13024-024-00779-9.
License: This is an open access protocol distributed under the terms of the Creative Commons Attribution License, which permits unrestricted use, distribution, and reproduction in any medium, provided the original author and source are credited
Protocol status: Working
We use this protocol and it's working
Created: April 30, 2025
Last Modified: May 27, 2025
Protocol Integer ID: 204067
Keywords: GCase, iPSC, dopaminergic neurons, PFB-FDGlu, live-imaging, cellular assay, imaging of gcase activity, cell analysis of gcase activity, assessing gcase activity, active gcase enzyme, fdglu gcase substrate, gcase activity, cell imaging, derived dopaminergic neuron, dopaminergic neuron, fluorescence detection, fdglu probe, cell imaging with the opera phenix, fluorescent dye, cell analysis, lysosomal compartments upon cellular uptake, fdglu, fdglu probe this protocol, lysosomal compartment, cellular uptake, cell viability, cell, neuron
Funders Acknowledgements:
Michael J. Fox Foundation for Parkinson's research
Grant ID: MJFF-020696
Abstract
This protocol describes the procedure for assessing GCase activity in iPSC-derived dopaminergic neurons using the PFB-FDGlu GCase substrate. The assessment is performed via live-cell imaging with the Opera Phenix high-content imaging system and analyzed using Harmony software.
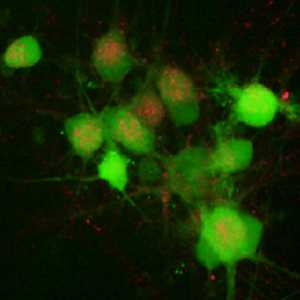
PFB-FDGlu is a cell-permeable compound that localizes to endosomal and lysosomal compartments upon cellular uptake, without compromising cell viability. When cleaved by active GCase enzymes, it releases a green-fluorescent dye (PFB-F), enabling specific, single-cell analysis of GCase activity through fluorescence detection.
Materials
Safety warnings
Be extremely gentle when dispensing into the wells, as dopaminergic neurons are prone to detaching with forceful pipetting
Before start
iPSC-derived dopaminergic neurons are cultured on 96-well plates for up to 4 to 6 weeks of differentiation. We use black Costar 96-well assay plates (Corning cat. no. 3904), which are compatible with imaging using the Opera Phenix high-content screening system.
One hour prior to imaging, turn on the Opera Phenix high-content screening system. Set the incubation chamber temperature to 37 °C and adjust the CO₂ concentration to 5%.
CBE treatment
16h
For the negative control, incubate neurons Overnight at 37 °C with 25 micromolar (µM) of the GCase inhibitor Conduritol B epoxide (CBE)
16h
Labeling lysosomes with LysoTracker Deep Red
30m
Prepare a LysoTracker Deep Red working solution at 50 nanomolar (nM) in media. Remove the existing media from the wells and add 60 µL of the LysoTracker solution. Incubate for 00:30:00 at 37 °C .
30m
Preparing GCase substrate stock solution
While the cells are incubating, prepare the GCase substrate (PFB-FDGlu) stock solution. Reconstitute one 5 mg vial of PFB-FDGlu in 154 µL of DMSO for a 37.5 millimolar (mM) stock, then aliquot into 10 µL single-use stock vials.
Store aliquots at -20 °C , protected from light, and avoid repeated freeze-thaw cycles.
Addition of the GCase substrate
1. Prepare the PFB-FDGlu working solution by diluting the stock 1:200 in FluoroBrite DMEM.
2. Carefully remove the LysoTracker Deep Red solution from the wells and gently add 50 µL of the PFB-FDGlu working solution to each well.
3. Proceed with imaging
Imaging using the Opera Phenix high-content imaging system
2h 30m
1. Insert the prepared plate into the Opera Phenix chamber.
2. Utilize a 40× water immersion objective. Capture images using the 488 nm and 647 nm laser channels. Acquire 15-18 fields of view per well every 00:15:00 for a total duration of 02:30:00 . Maintain the plate under standard cell culture conditions (37 °C , 5% CO₂) throughout the imaging session.
2h 30m
Image Analysis Workflow in Harmony Software
- Load Images Open the Data Analysis tab in the Harmony software and load the desired image dataset.
- Create an Analysis Sequence
- Identify Cells Use the Alexa 647 channel with the P method to detect cells. Parameters: Area > 100 µm², Splitting Sensitivity: 0.70, Common Threshold: 0.55). Save this population as "Cells".
- Select Cell Population Apply Common Filters to the "Cells" population to refine it, creating a new population named "Cells Selected".
- Calculate Morphological Properties For the "Cells Selected" population, use the Standard Method to calculate the Area.
- Calculate Intensity Properties
- For the Alexa 647 channel, use the Standard Method to calculate the mean intensity for the "Cells Selected" population.
- For the Alexa 488 channel, use the Standard Method to calculate the mean intensity for the "Cells Selected" population.
7. Define Results Output
- Output: Cells Selected - Intensity Cell Alexa 647 Mean
- Output: Cells Selected - Intensity Cell Alexa 488 Mean
8. Run the Analysis
9. Export Data
Download the results as a CSV file.
Assess GCase activity
- From the table generated by Harmony, calculate the ratio of the PFB-FDGlu mean fluorescence intensity to the LysoTracker Deep Red (647) baseline reading (at t=0) for each time point.
- Enter these calculated values into Prism to generate the GCase activity curves.