Jul 17, 2025
Kitless adenosine deaminase activity assay
- 1Arcadia Science
- Audrey Bell: Visualization
- Brae Bigge: Supervision
- Harper Wood: Investigation, Methodology, Writing
- Arcadia Science


Protocol Citation: Audrey Bell, Brae Bigge, Harper Wood 2025. Kitless adenosine deaminase activity assay. protocols.io https://dx.doi.org/10.17504/protocols.io.bp2l62obdgqe/v1
License: This is an open access protocol distributed under the terms of the Creative Commons Attribution License, which permits unrestricted use, distribution, and reproduction in any medium, provided the original author and source are credited
Protocol status: Working
We use this protocol and it's working
Created: October 17, 2024
Last Modified: July 17, 2025
Protocol Integer ID: 110096
Keywords: adenosine deaminase, enzyme activity, activity assay, ADA, kitless, absorbance, plate reader, measuring adenosine deaminase activity, adenosine deaminase activity in body fluid, ada enzyme, multiple ada enzymes in high throughput, multiple ada enzyme, regulating adenosine, adenosine into inosine, adenosine, kinetic assay, based kinetic assay, enzyme, absorbance assay, deaminase activity, assay, purine nucleotide, recycling purine nucleotide, inosine, ada, number of protein, protein
Abstract
This protocol describes an absorbance assay to measure adenosine deaminase (ADA) activity without purchasing a commercial kit. We adapted it from "Development of a rapid, microplate-based kinetic assay for measuring adenosine deaminase activity in body fluids" (Lu & Grenache, 2012).
Citation
LINK
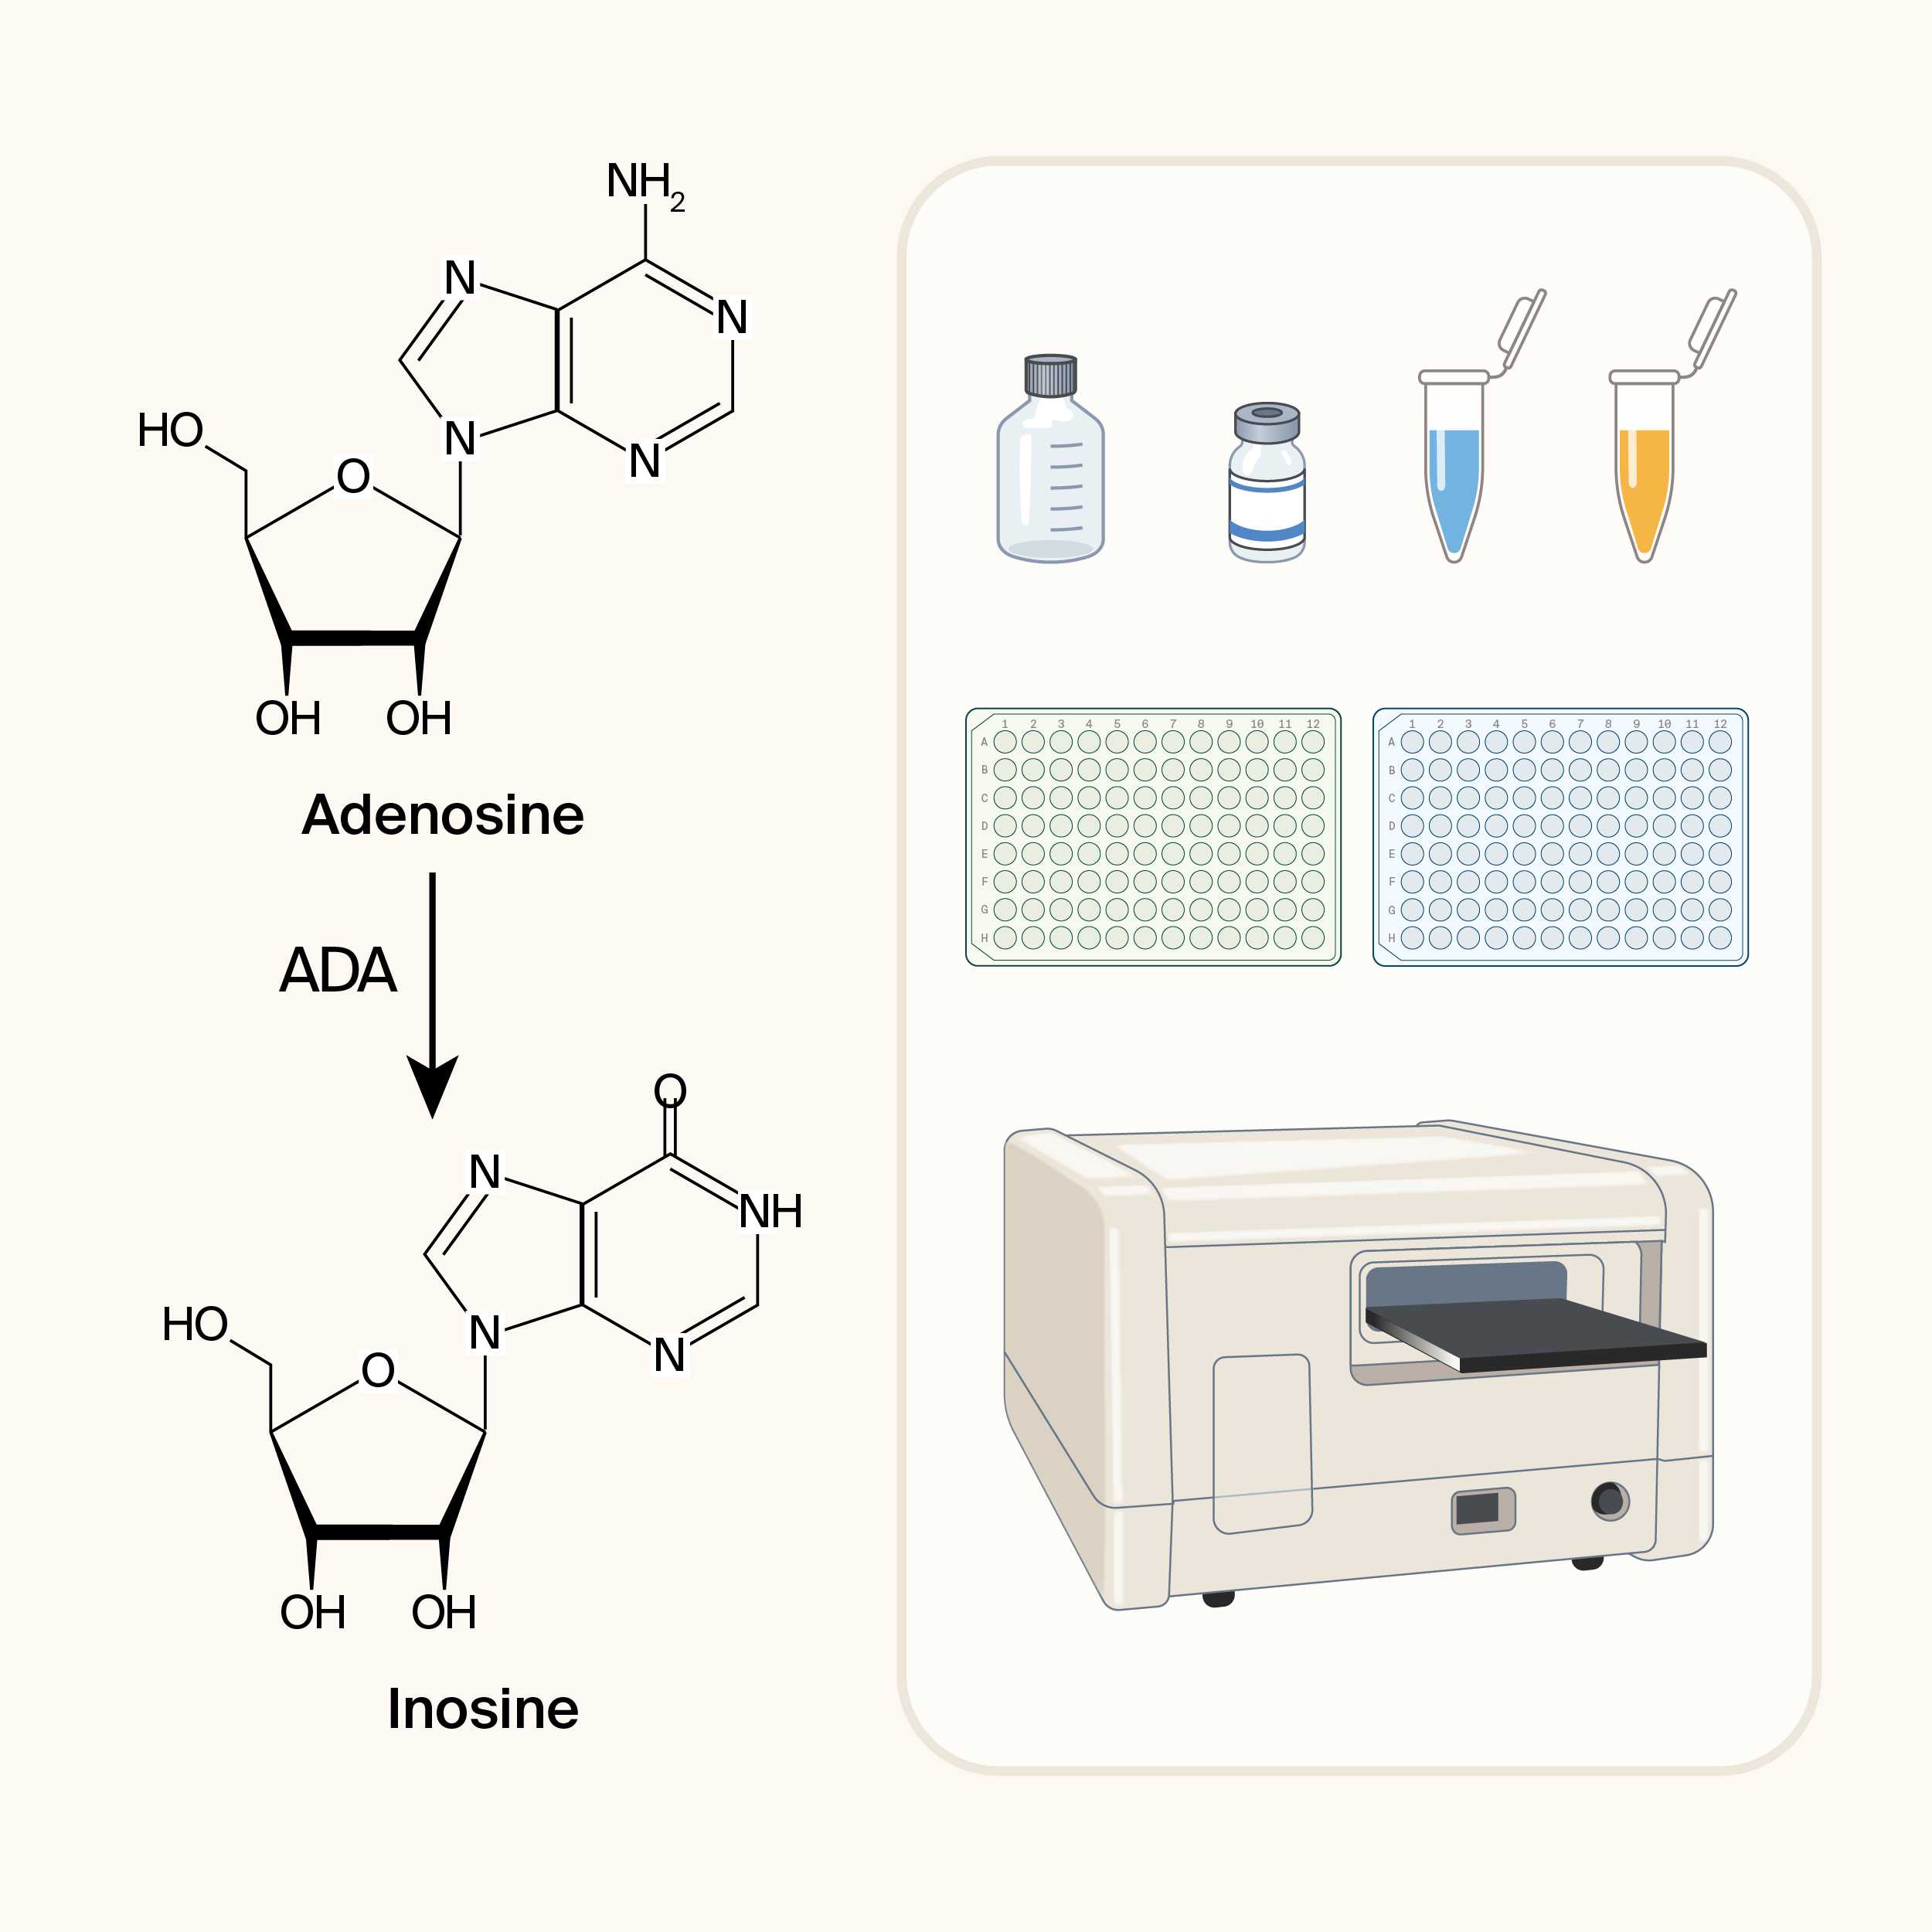
Adenosine deaminase irreversibly hydrolyzes adenosine into inosine and ammonia. This activity is important for regulating adenosine-mediated signaling and recycling purine nucleotides. We modified this assay to compare multiple ADA enzymes in high throughput.
This protocol represents the basic steps we use to assess our ADA enzymes. We adjust the plate layout and concentrations used depending on the number of proteins to assay and their predicted qualities (e.g., relative activity). We've tested eight enzymes at a time with this layout. We also use a reduced, single substrate concentration layout for yes/no readouts of activity on up to 96 enzymes at a time.
Quick reference graphical protocol for this assay.
Image Attribution
Arcadia Science
Materials
We used the following materials and equipment — it should be fine to substitute with other brands.
- Adenosine deaminase enzyme
- Adenosine in 50 mM phosphate buffer, pH 7.4 (Millipore Sigma, #A9251 - 5G)
- 1 mM inosine in 50 mM phosphate buffer, pH 7.4 (Millipore Sigma, #I4125 - 5G)
- 50 mM phosphate buffer, pH 7.4
- 96-well UV-transparent microplates (VWR, #66021-983) for your reaction plate
- 96-well plate for mixing (any product) for your substrate plate
- SpectraMax iD3 plate reader, Molecular Devices
Materials
Use the following materials for this protocol.
Enzyme:
- 0.1 µM adenosine deaminase (ADA) enzyme
Note
We used adenosine deaminase from calf intestine (Millipore Sigma, manufactured by Roche, #10102105001). Results are comparable to human results in (Lu & Grenache, 2012). This product is a solution in 50% glycerol (v/v), 10 mM potassium phosphate, with a pH of approximately 6. We didn't buffer exchange before assaying.
Whatever your enzyme concentration, we recommend diluting to a starting stock of 0.1 μM. Using 10 μL of this per well results in a final concentration of 4 nM.
Substrate:
- 1 mM adenosine in 50 mM phosphate buffer, pH 7.4 (Millipore Sigma, #A9251 - 5G)
Standards:
- 1 mM adenosine in 50 mM phosphate buffer, pH 7.4 (Millipore Sigma, #A9251 - 5G)
- 1 mM inosine in 50 mM phosphate buffer, pH 7.4 (Millipore Sigma, #I4125 - 5G)
Buffer:
- 50 mM phosphate buffer, pH 7.4
Plate:
- 96-well UV-transparent microplates (VWR, #66021-983) for your reaction plate
- 96-well plate for mixing (any product) for your substrate plate
Note
Though Lu & Grenache use UV-transparent plate sealers, we find the effects of evaporation to be negligible on this time scale. As such, we read the plates without a lid or seal.
Plate reader:
- SpectraMax iD3, Molecular Devices
Prepare reaction plate
These instructions describe preparing one row of your plate. One full row is used for each experiment. If you're testing multiple enzymes or multiple enzyme concentrations, simply repeat with as many rows as you have samples.
First, prepare the reactions for analysis in a UV-transparent "reaction plate" so that you'll be ready to read the plate immediately upon the addition of substrate.
Prepare row A of your reaction plate with the requisite amount of 50 mM phosphate buffer (pH 7.4) in each well (see table).
REACTION PLATE
| Well | Buffer volume (µL) | |
| A1 | 200 | |
| A2 | 200 | |
| A3 | 200 | |
| A4 | 200 | |
| A5 | 200 | |
| A6 | 200 | |
| A7 | 200 | |
| A8 | 225 | |
| A9 | 237.5 | |
| A10 | 225 | |
| A11 | 237.5 | |
| A12 | 200 |
Add 10 µL of enzyme to each of the test wells (here, A1–A7).
Note
For our specific ADA enzyme, we found that a final concentration of 4 nM enzyme provides consistent results in the linear range. To reach the desired final concentration of 4 nM enzyme, we use 10 µL of 0.1 µM enzyme. See "Troubleshooting for your specific enzyme" if you need to determine this for a new protein.
Add the standards to the standard wells (A8–A12).
- Add 25 µL of 1 mM inosine to wells A8 and A12.
- Add 12.5 µL of 1 mM inosine to well A9.
- Add 25 µL of 1 mM adenosine to wells A10 and A12.
- Add 12.5 µL of 1 mM adenosine to well A11.
Prepare substrate plate
Prepare your adenosine gradient in your "substrate plate" so that you'll be ready to add the reagents to all reaction wells in parallel. Prepare 60 µL to ensure a full 40 µL can be delivered to each reaction well.
SUBSTRATE PLATE
| Well | Substrate volume (µL) | Buffer volume (µL) | Final concentration tested (uM) | |
| A1 | 45 | 15 | 120 | |
| A2 | 37.5 | 22.5 | 100 | |
| A3 | 30 | 30 | 80 | |
| A4 | 22.5 | 37.5 | 60 | |
| A5 | 15 | 45 | 40 | |
| A6 | 7.5 | 52.5 | 20 | |
| A7 | 0 | 60 | 0 |
Leave both plates on the bench at room temperature for 5 min.
Note
We found more consistent results after allowing all reagents to come to room temperature.
Read data
While the plate is incubating at room temperature, set up your plate reader for baseline measurements.
Note
As our plate reader can't normalize while taking kinetic measurements, we collect baseline data in two phases to find the conversion factor between the path length normalized value (Endpoint mode) and the unnormalized value (Kinetic mode). See section "Normalization & data processing" for details.
Prepare the plate reader for endpoint measurement with the following settings (or equivalent for your plate reader):
- Endpoint
- Absorbance at 265 nm
- Standard, clear bottom, lidless plate
- Temperature at 37 °C
- Path check ON
- Fast read method
- Shake prior to read
Read plate to obtain values normalized for the path length.
After reading, adjust the settings for kinetic mode:
- Kinetic
- Absorbance at 265 nm
- Standard, clear bottom, lidless plate
- Temperature at 37 °C
- 3 min total, read every 30 s
- Fast read method
- Shake prior to first read
Note
Be sure to double-check the wavelength after switching to kinetic mode. Our Molecular Devices plate reader resets the selected wavelength if the mode changes.
Read plate to obtain baseline, unnormalized data.
Now that we've obtained baseline values, remove the plate and prepare for analysis of the enzymatic reactions.
Set up the plate reader for the next step:
- Kinetic
- Absorbance at 265 nm
- Standard, clear bottom, lidless plate
- Temperature at 37 °C
- 45 min total, read every 30 s
- Fast read method
- Shake prior to first read
Note
You'll want to act fast, so be sure your plate reader settings are correct before adding substrate.
Using a multichannel P200 set to 40 µL, transfer 40 µL from wells A1–A7 of the substrate plate into wells A1–A7 of the reaction plate. Add substrate as quickly as possible, pipetting up and down to mix before moving on. Avoid introducing bubbles as much as possible.
Return the plate to the plate reader as soon as possible and read for 45 min in kinetic mode. See the type of readings you might expect in the image below.
Example assay data with seven concentrations of substrate.
Solid circles represent data collected at the highest substrate concentration. Empty triangles represent the no-substrate blank. The data points and curves in between represent intermediate concentrations of substrate. We created this plot in the SpectraMax software associated with our Molecular Devices plate reader.
45m
Normalization & data processing
Normalize your data.
Before plotting, find your path length conversion factor by dividing each of the Endpoint data for your standards (from step 5.2) by the Kinetic data for your standards (from step 5.4). Take the average of these fractions to find your conversion factor.
Multiply all experimental values (from step 6.3) by the path length conversion factor.
Convert your data from change in absorbance to adenosine consumed.
Using each of your path length normalized standards, find the extinction coefficients of adenosine and inosine.
A = εcl, where l has been normalized to 1 cm.
ε = A/(cl), where l has been normalized to 1 cm.
Compare the two values found from the high and low standards to assess the reproducibility of εA and εI. Ideally, the resultant values from the high and low standards will be similar.
For your experimental data, multiply each absorbance value by (εA − εI) to convert to the concentration of adenosine.
For more information on Michaelis–Menten kinetics, we like LibreTexts' explainer:
Citation
LINK
We won't go into detail on data analysis here, but be sure to normalize your data as above before analyzing further.
Troubleshooting for your specific enzyme
When we approached this assay with our specific calf intestine ADA, we took the following steps to assess its activity and appropriate concentration range for our measurement.
Repeat this protocol with a variety of enzyme concentrations. We tested a range of 10× dilutions from 400 nM to 0.04 nM to find the most consistently measurable results.
If the reaction is too fast, you'll miss the linear portion before being able to place the plate on the plate reader, and the resulting plot will look totally flat. If your reaction is too slow, you risk losing the high-throughput quality of this assay.
Once you find an enzyme concentration that allows you to catch the linear portion of the reaction (like in our example plot in step 6.3), use this same concentration consistently while varying substrate concentration. We found that 4 nM enzyme worked best.
Protocol references
Lu J, Grenache DG. (2012). Development of a rapid, microplate-based kinetic assay for measuring adenosine deaminase activity in body fluids. https://doi.org/10.1016/j.cca.2012.05.001