Aug 18, 2025
Isolation of Bioactive Insulin via C-Chain Cleavage and Inclusion Body-Based Purification from E. coli BL21-(DE3)
- Durvesh Burhade1,
- Niliksha Patel1
- 1Department of Biotechnology, Parul University
- Durvesh Burhade: Scientific Researcher & Author
- Niliksha Patel: Scientific Illustrator
- Durvesh Burhade Lab



Protocol Citation: Durvesh Burhade, Niliksha Patel 2025. Isolation of Bioactive Insulin via C-Chain Cleavage and Inclusion Body-Based Purification from E. coli BL21-(DE3). protocols.io https://dx.doi.org/10.17504/protocols.io.bp2l6yj7kvqe/v1
Manuscript citation:
License: This is an open access protocol distributed under the terms of the Creative Commons Attribution License, which permits unrestricted use, distribution, and reproduction in any medium, provided the original author and source are credited
Protocol status: Working
We use this protocol and it's working
Created: June 15, 2025
Last Modified: August 18, 2025
Protocol Integer ID: 220272
Keywords: Recombinant insulin, Inclusion body purification, Sulfitolysis, Anion exchange chromatography (AEX), Reverse-phase chromatography (RPC), recombinant human insulin, isolation of bioactive insulin, functional insulin, bioactive insulin, active insulin, containing proinsulin, final purification, chain cleavage, based purification
Disclaimer
This protocol was developed and executed in compliance with biosafety and ethical regulations. All recombinant DNA work was conducted using E. coli BL21 (DE3), a non-pathogenic laboratory strain, under approved containment conditions. Appropriate aseptic techniques and waste management protocols were strictly followed. This procedure is intended solely for research purposes and not for clinical or therapeutic use.
The authors and associated members of this project assume no responsibility or liability for any damage, injury, or loss resulting from the use, misuse, or misinterpretation of this protocol by others.
Abstract
This protocol describes the post-expression processing of recombinant human insulin in E. coli BL21 (DE3), focusing on the cleavage of the C-chain to obtain functional insulin composed of A and B chains. Following optimal expression using 0.5 mM IPTG in Terrific Broth, the cells were lysed via high-pressure homogenization. Inclusion bodies containing proinsulin were isolated, washed with Triton X-100 buffer, and prepared for downstream solubilization and refolding. The C-chain was cleaved during the refolding process, yielding biologically active insulin. Final purification and lyophilisation produced stable, functional insulin suitable for further biochemical and structural characterisation.
Graphical Abstract of Bioactive Insulin
Guidelines
- Ensure recombinant gene constructs comply with institutional and national biosafety regulations.
- Sterilize all cultureware and operate under aseptic conditions to prevent contamination.
- All reagents (IPTG, antibiotics, urea, DTT, etc.) should be freshly prepared and validated.
- Use cold-chain handling for proteins and include protease inhibitors during lysis and purification.
- Buffer pH, salt concentration, and temperature must be tightly controlled to maintain insulin stability.
Materials
General Molecular Biology Reagents
- Plasmid: pET-41a(+) vector containing recombinant human insulin gene
- Competent E. coli BL21 (DE3) strain
- IPTG (Isopropyl β-D-1-thiogalactopyranoside), 1 M stock
- LB broth (Luria–Bertani)
- LB agar powder
- Kanamycin sulfate (stock: 50 mg/mL)
Competent Cell Preparation (TSS Method)
- PEG 8000, 10% (w/v)
- MgCl₂, 1 M stock
- DMSO
- TSS buffer components
- Sterile Milli-Q water
Lysis and Homogenization
- Tris-HCl, pH 8.0, 50 mM
- NaCl, 100 mM
- EDTA, 1 mM
- Triton X-100, 1% (v/v)
- Lysozyme, 1 mg/mL
- DNase I, 10 µg/mL
- MgCl₂, 5 mM
- Protease inhibitor cocktail (optional)
Inclusion Body Washing and Solubilization
- Urea, 8 M
- NaCl, 500 mM
- Triton X-100, 0.5–1% (w/v)
- Tris-HCl, pH 8.0
- β-Mercaptoethanol or DTT (reducing agents)
Sulfitolysis and Refolding
- Sodium sulfite (Na₂SO₃)
- Sodium tetrathionate (Na₂S₄O₆)
- Glycine, 1 M (for pH control)
- Refolding buffer components: Tris, EDTA, NaCl
Trypsin Digestion (C-chain cleavage)
- Trypsin enzyme (MS-grade, bovine/porcine)
- CaCl₂, 2 mM (enzyme co-factor)
- Digestion buffer: Tris-HCl, pH 8.0
Chromatography Buffers
➤ AEX Buffers (pH 10):
- Glycine-NaOH, 1 M stock
- NaCl, 1 M stock (29.2 g/L)
➤ Reverse-Phase Chromatography:
- Acetonitrile (HPLC-grade)
- 0.1% TFA (Trifluoroacetic acid) or Formic acid
- Milli-Q water
II. Equipment and Consumables
Microbiology & Culture
- Autoclave
- Shaking incubator (37 °C and 25 °C)
- Spectrophotometer (for OD600)
- Erlenmeyer flasks (250 mL, 500 mL, 2 L, 5 L)
- Centrifuge tubes (15 mL, 50 mL)
Lysis & Homogenization
- Homogenizer (probe or Dounce)
- Centrifuge (Refrigerated, up to 10,000 rpm)
- Ice buckets and racks
Chromatography Systems
- FPLC/HPLC system (e.g., ÄKTA Pure or equivalent)
- Q-Sepharose column (5 mL)
- Resource 15 RP column (5 mL)
- Syringe filters (0.22 µm)
- Filtration units and tubing sets
Analytical Reagents and Tools
SDS-PAGE
- Pre-cast 10% SDS-PAGE gels (10 wells)
- MES Running Buffer (1×)
- Protein loading dye (Reducing and Non-reducing)
- Protein molecular weight marker
- SDS-PAGE staining solution (Coomassie Brilliant Blue or Silver stain)
Mass Spectrometry
- LC–MS grade solvents (Acetonitrile, water, formic acid)
- Sample desalt columns or ZipTips (if needed)
- Access to LC–MS instrument (ESI or MALDI-based)
Storage and Consumables
- Cryovials (for glycerol stocks)
- Sterile pipette tips (filtered)
- Sterile Petri plates
- Sterile 0.22 µm filters
- pH meter
- Vortex and heating block
- Vacuum centrifuge or lyophilizer (optional, for insulin drying)
Safety warnings
All procedures involving recombinant DNA, bacterial cultures, and high-pressure equipment must be conducted with extreme caution. Personnel must be adequately trained and fully familiar with biosafety level 1 practices before beginning any part of this protocol. Handling of E. coli BL21 (DE3) should be performed in a sterile environment to prevent cross-contamination or accidental release. The use of high-pressure homogenisers such as PandaPlus requires adherence to the manufacturer's safety guidelines to avoid physical injury or equipment damage. Failure to clean and sanitise equipment before and after use can result in hazardous chemical exposure or biological contamination. Triton X-100, isopropyl alcohol (IPA), and NaOH solutions are chemical irritants and should be handled with gloves and eye protection in a fume hood. Centrifugation at high speeds must only be performed using appropriate rotors and balanced loads to avoid catastrophic failure. Any deviation from the specified parameters, especially temperature, pressure, or buffer composition, may result in incomplete lysis, protein degradation, or failure to recover the functional insulin product. This protocol is intended solely for research use. The authors strictly disclaim any responsibility for injury, loss, damage, or failure arising from improper execution, misuse, or unauthorised modification of the protocol.
Ethics statement
This study does not involve any experiments on animals or humans. All experimental procedures were conducted using Escherichia coli BL21 (DE3), a laboratory-grade, non-pathogenic microbial strain, under biosafety level 1 (BSL-1) conditions. Therefore, ethical approval from an Institutional Animal Care and Use Committee (IACUC) or equivalent was not required. However, all protocols were carried out in strict accordance with the guidelines set forth by the Institutional Biosafety Committee (IBC) to ensure compliance with internationally accepted standards for safe handling of genetically modified organisms.
Before start
- Confirm that your protein expression has been optimised (e.g., 0.5 mM IPTG induction at 25 °C for 16 hours) and yields sufficient biomass.
- Prepare all media (LB, Terrific Broth) and sterilise by autoclaving.
- Prepare the stock solutions
- Calibrate and clean all equipment, including the centrifuge, homogeniser (PandaPlus), and spectrophotometer.
- Have Oak Ridge centrifuge tubes, homogeniser accessories, and ice available before starting.
- Ensure access to a -22 °C freezer for pellet handling.
- Obtain protease inhibitor tablets and Triton X-100 for lysis and washing steps.
- Ensure that the lyophilisation equipment is functioning and cleaned if you plan to proceed immediately after purification.
Construct of Plasmid
4d
In this protocol, the expression vector pET-41a(+) was employed for the production of recombinant insulin.
Note
The gene of interest encoding insulin was already cloned into the plasmid b
efore the initiation of our work. The specific insulin gene sequence integrated into the vector may vary depending on the intended application or insulin type (e.g., human insulin, insulin analogues). In our case, the recombinant construct in pET-41a(+) was provided by a separate department. Our role began with the utilisation of this construct, starting from the preparation of competent E. coli BL21 (DE3) cells, followed by transformation and subsequent downstream processing, including inclusion body isolation and lyophilisation.
4d
Competent Cells Preparation
1d 0h 26m
Chemically competent Escherichia coli BL21 (DE3) cells were prepared using the TSS method (Transformation and Storage Solution), a single-step, time-efficient alternative to the conventional CaCl₂ method. We will use the TSS Buffer to get our desired competent cells.
1m
Buffer Preparation: TSS Buffer (pH: Not Required to adjust, 5 mL)
| A | B | |
| Reagent | Final Concentration | |
| PEG 8000 | 10% (w/v) | |
| MgCl₂ | 10 mM | |
| DMSO | 5% (v/v) |
Table (1.1): Composition of TSS Buffer
30m
Prepare 10 mL of Autoclaved L.B Broth Media for Culture Preparation.
Note
Calculations (Media Preparation)
0.25 grams -> 10 mL of Water
10m
Inoculate a single colony (For better results, use single isolated colonies) of E. coli BL21 (DE3) into10 mL of Autoclaved L.B Broth Media
Note
For optimal results, select a single, well-isolated colony of medium size rather than clustered colonies. Careful selection at this stage is critical for achieving consistent and efficient protein expression
5m
Incubate the culture overnight at 200 rpm, 37°C, 16:00:00
16h 30m
Prepare 100 mL of L.B Broth for sub-culturing
Note
Calculation (Sub-Culturing)
2.5 grams -> 100 mL of Water
10m
Dilute the overnight culture in a 1:100 ratio to 100 mL of Autoclaved L.B Broth Media 100 mL of Autoclaved L.B Broth Media
Note
Take 1 mL of Culture from STEP 6 and dilute in 99 mL of Autoclaved L.B Broth Media
Note
Take 1 mL of Culture from STEP 6 and dilute in 99 mL of Autoclaved L.B Broth Media
10m
Incubate at 180 rpm, 37°C until the optical density (OD₆₀₀) reaches 0.4–0.5 (mid-log phase). Check the OD₆₀₀ by a UV Spectrophotometer, take L.B Broth as a BLANK.
Note
In this step, incubation typically requires approximately 5 hours to reach an OD₆₀₀ of 0.5. However, the time may vary depending on the specific insulin analogue and growth conditions.
5h 30m
Immediately place the culture on ice for 00:30:00 minutes
30m
Pellet the cells by centrifugation at 4000 rpm, 4°C, 00:10:00
10m
Gently resuspend the cell pellet in 1 mL of TSS Buffer (Should be placed in ice-cold). Avoid vortexing to preserve cell membrane integrity.
10m
Dispense 50 µL aliquots into sterile, pre-chilled microcentrifuge tubes. Store at –80 °C for long-term use.
30m
Transformation
19h 2m 45s
Transformation was performed using chemically competent E. coli BL21 (DE3) cells prepared via the TSS method. This strain, commonly used in industrial biotechnology, harbours the T7 RNA polymerase gene under control of the lacUV5 promoter, allowing high-level IPTG-inducible expression.
Note
The recombinant plasmid utilised in this experiment carried the gene of interest under a T7 promoter along with a kanamycin resistance marker for selection. The transformation procedure was optimised to ensure high efficiency while preserving cell viability.
Remove a 50 µL aliquot of TSS-prepared competent E. coli cells from –80 °C and thaw on ice for 00:15:00 Minutes
15m
Add 0.1 µL of Plasmid DNA in an aliquot competent cells
Note
This plasmid DNA is designed with a certain concentration for which the required volume we add is 100ng 0.1 µL PLASMID DNA
10m
The mixture was incubated on ice for 00:15:00 minutes to facilitate the interaction between plasmid DNA and the bacterial membrane, promoting uptake.
15m
While the TSS method generally does not require heat shock, a brief 42 °C Celsius heat shock for 00:00:45 Seconds can sometimes enhance transformation efficiency. In our case, the heat shock was applied.
45s
Immediately return the tubes to ice for 00:02:00 minutes
2m
Prepare 1000 µL of Autoclaved L.B Broth Medium
CALCULATION
2.5 grams ->100 mL
0.025 grams -> 1 mL
10m
Add 800 µL of Autoclaved L.B Broth of sterile LB broth to the transformation mixture Eppendorf tube.
10m
Incubate 180 rpm, 37°C, 01:00:00
This step is known as regeneration
1h
Prepare 100 mL of L.B Agar for plating
Note
Make 2 Agar plates containing 25 mL of L.B Agar each.
10m
Add 50 mg/mL of Kanamycin Antibiotic to the agar plate
CALCULATION
50mg ->1 mL
10m
After the solidification of agar, add 100 µL of culture . Spread evenly using a sterile glass spreader or L-spreader.
10m
Incubate the plates inverted 180 rpm, 37°C, 16:00:00
16h 30m
Colony Forming Screening
5m
After 18 hours, well-isolated colonies appeared on the agar surface, indicating successful uptake and expression of the recombinant plasmid.
Figure (1.1): Colonies of E.coli BL-21 (DE3)
Figure (1.2): Colony Counting by classic method
Note
Figure (1.2) The photograph shows a lawn of discrete, circular colonies obtained after plating E. coli BL21 (DE3) cells transformed with the recombinant plasmid and incubating overnight at 37 °C. The plate was subsequently used to determine transformation efficiency by manual colony counting (“classic method”).
Figure (1.3): Formula to calculate transformant efficiency
5m
Expression Screening (IPTG Induction)
22h 10m
Following successful transformation and colony selection, expression screening was conducted to identify optimal conditions for maximal recombinant protein production. This involved systematically varying IPTG concentration and incubation temperature, two key parameters known to influence the expression yield and solubility of recombinant proteins in E. coli. The goal was to determine the condition that favours high-level expression of the target protein, preferably as inclusion bodies to facilitate downstream purification.
Note
We selected two incubation temperatures—25 °C and 37°C—to observe how a slower, low-temperature expression might affect solubility compared to rapid expression at a higher temperature.
Simultaneously, we tested two concentrations of Isopropyl β-D-1 thiogalactopyranoside (IPTG), a molecular mimic of allolactose that induces the expression of genes under the lac operon.
The concentrations used were 0.1 mM and 0.5 mM, giving us a matrix of four different induction conditions:
(1) 25 °C at 0.1 mM IPTG,
(2) 25 °C at 0.5 mM IPTG,
(3) 37 °C at 0.1 mM IPTG, and
(4) 37 °C at 0.5 mM IPTG.
Prepare 10 mL of L.B Broth Medium for primary inoculation
CALCULATION
2.5 grams for 100 mL
0.25 grams for 10 mL
10m
Pick a single, well-isolated colony from the transformation plate and inoculate it into 10 mL of Primary Culture and incubate 180 rpm, 37°C, 16:00:00
10m
Prepare 10 mL of Autoclaved L.B Broth Media for different Batch each (x5)
CALCULATIONS
2.5 grams -> 100 mL
0.25 grams -> 10 mL (BATCH 1)
1.25 grams -> 50 mL (BATCH 5)
5m
Dilute 1% of the overnight culture (e.g., 100 µL into 10 mL) into five 10 mL cultures of fresh LB broth (with kanamycin). Make an extra L.B Broth culture as a reference
CALCULATIONS
100 µL of Primary Culture -> 10 mL of Batch Culture
10m
Monitor OD₆₀₀ until cultures reach 1.0 (post-log phase).
Add IPTG (Isopropyl β-D-1-thiogalactopyranoside) after reaching 0.6 OD₆₀₀ at different conditions mentioned in Table 1.2
10m
Table (1.2): Different conditions for Expression screening with Results
Incubate the Induced Batch (x4) & One Uninduced Reference batch (x1)
Total 5 Batch
The 4-hour induced batch (x2) was incubated 180 rpm, 37°C, 04:00:00
4h
The 4-hour induced batch (x2) was harvested4000 rpm, 4°C, 00:10:00 & stored at -20 °C Deep Freeze
15m
The 16-hour induced batches (x2) were incubated 180 rpm, 25°C, 16:00:00
16h
The 16-hour induced batches (x2) were harvested4000 rpm, 4°C, 00:10:00
10m
The uninduced sample was directly analysed with SDS-PAGE after completion of 16-hour batches
Samples were then analysed using SDS-PAGE to evaluate the expression level and solubility of the protein under each condition.
Running Buffer: MES (1X)
Running Time: 35 Minutes (Depends on Volts)
Volts: 170 V
Wells: 10 well gel
Loading Dye: Non-Reduced
Gel Type: Pre-Cast (10 %) SDS
Figure (1.4): Effects of IPTG and temperature on expression of recombinant protein analysed by SDS-PAGE (Soluble fractions or supernatant)
RESULTS (Figure 1.3): No Bright Bands in the soluble fraction were visible
Figure (1.5): Effects of IPTG and temperature on expression of recombinant protein analysed by SDS PAGE (insoluble fraction or pellet)
RESULTS Figure (1.4): Bright Band at 10Kda was visible
1h
Scale-Up (Pilot Scaling to 2 Litre Batch)
1d 9h 30m
Based on the results from expression screening, the optimal condition for recombinant protein production was selected and used for pilot-scale expression. The goal of this step is to scale up the bacterial culture volume to obtain sufficient biomass for downstream processes such as inclusion body isolation, C-chain cleavage, and insulin purification. All pilot-scale fermentations were conducted using LB medium supplemented with kanamycin, induced with IPTG, and incubated under previously optimised conditions.
Prepare 25 mL of L.B Broth Media for primary culture
CALCULATE
2.5 grams -> 100 mL
0.625 grams ->25 mL
10m
Inoculate a single confirmed positive colony (Kanamycin Resistant) into 25 mL of Autoclaved L.B Broth Media grow overnight at180 rpm, 37°C, 16:00:00
16h
Prepare 500 mL of Autoclaved T.B Broth (x4) Batch for secondary culture.
Note
T.B Broth media is used for higher growth of bacteria in secondary culture. 500 mL of broth was stored in a 2-litre flask. We made 4 batches containing 500 mL TB Broth in a 2-Litre flask each. So the total was 2 Litres of TB Broth Media
CALCULATION
47.6 grams -> 1000 mL (1 L)
23.8 grams -> 500 mL (BATCH 1)
95.2 grams -> 2000 mL (2 L)- (BATCH 4)
10m
After the overnight incubation, 1% of the primary culture was used to inoculate four 2-litre Erlenmeyer flasks, each containing 500 mL of Terrific Broth (TB) supplemented.
CALCULATION
0.25 mL of Primary Culture in 500 mL of Secondary Culture (1 BATCH)
1 mL Total -> 2 Litres
10m
Incubate the secondary culture at 180 rpm, 25°C till 0.95 O.D is reached.
Add 0.5 mM IPTG when O.D reaches 0.95
CALCULATION
Stock (1M) of IPTG
C1 V1 = C2 V2
1000 mM X x mL = 0.5 mM X 500 mL
x = (0.5 mM x 500 mL) / 1000
x = 0.25 mL IPTG -> 500 mL of Secondary Culture
x = 1 mL of Total IPTG -> 2 Litres 0f Total Secondary Culture
x = Required volume of IPTG
5m
Incubate the secondary culture at 180 rpm, 25°C, 16:00:00
16h
Harvest the induced Culture at 8000 rpm, 4°C, 00:35:00
35m
RESULT: The resulting cell pellet weighed approximately,
18 grams from the total 2-litre culture (4 flasks). This pellet served as the starting material for all downstream steps, including lysis and inclusion body preparation.
20m
Preparation and Use of Lysis Buffer (Inclusion Body Preparation)
10m
Buffer Preparation: Lysis Buffer (pH 8, 300 mL)
| A | B | C | D | |
| Reagent | Stock | Final Conc. | Volume Used | |
| Tris-HCl | 2 M | 50 mM | 7.5 mL | |
| NaCl | 5 M | 500 mM | 30 mL | |
| EDTA | 0.1 M | 1 mM | 3 mL | |
| Milli-Q Water | — | — | 259.5 mL | |
| Protease Inhibitor Tablet | — | — | 1 tablet |
Table (1.3): Components required for making lysis buffer for cell lysis.
Note
For each gram of pellet, we need 10 mL of Lysis Buffer
In our case, 18 grams of pellets need at least 180 mL of Lysis Buffer. We made up to 250 mL. Protease tablet should be added after adding all the components to
prevent protein degradation by endogenous proteases released during lysis.. Adjust the pH to 8.0
This step should be performed in a homogeniser at 6000 rpm, 00:10:00 . This step is not centrifugation, strictly performed in a homogeniser.
Note
This pre-homogenisation allowed proper dispersion of the pellet and better accessibility of buffer components to the cells, which significantly improved the efficiency of the subsequent high-pressure lysis step.
10m
Now our next step is to properly crush the cell with the help of High-Pressure cell disruption (Pandaplus Homogeniser) at
Homogenization of Lysate for Enhanced Inclusion Body Recovery
1h 35m
This step should be performed in a homogeniser at 6000 rpm, 00:10:00 . This step is not centrifugation, strictly performed in a homogeniser.
Note
This pre-homogenisation allowed proper dispersion of the pellet and better accessibility of buffer components to the cells, which significantly improved the efficiency of the subsequent high-pressure lysis step.
20m
Prepare 0.5 Molarity (M) NaOH for removing residual protein & debris from previous runs, and add to thehigh-pressure homogeniser.
CALCULATIONS
C1 V1 = C2 V2
5N V1 = 0.5 N 500 mL
V1 = 50 mL of NaOH in 500 mL of Milli-Q water
10m
Add the solution mixture to the high-pressure homogeniser at 1000 Bar and repeat this step at least 5 cycles.
Note
The pressure-driven disruption from both vertical and horizontal planes crushed the cells thoroughly.
30m
Centrifuge the solution mixture at 9000 rpm, 4°C, 00:20:00
Note
Use Oak Ridge tube for centrifugation. This step separated the insoluble fraction (containing inclusion bodies) from the soluble components. The efficient preparation of cell lysate and the separation of aggregates are vital for maintaining product purity and improving downstream yield.
20m
After centrifugation of the lysate, the supernatant was discarded. The pellet, consisting primarily of inclusion bodies, was retained for further processing.
Note
The inclusion bodies were visually observed as white or light beige in colour, typical of protein aggregation.
5m
Weigh the pellet mass. In our case, the weight obtained was approximately 3 grams (2.968 grams Precise).
Note
This weight was important for determining the buffer volumes required for the washing step.
10m
Washing of Inclusion Body
1h 10m
0.5 % ()A wash buffer was freshly prepared for cleaning the inclusion bodies. pH was adjusted to 8.0 using NaOH or HCl
Buffer Preparation: Wash Buffer (30 mL)
| Component | Stock | Final Conc. | Volume Used | |
| Tris-HCl | 2 M | 50 mM | 0.75 mL | |
| Triton X-100 | — | 0.5% (v/v) | 1.5 mL | |
| Milli-Q Water | — | — | 27.75 mL | |
| Total Volume | 30.00 mL |
Table (1.4): Wash buffer components.
Note
The total volume was calculated based on a 1:10 w/v ratio, meaning 10 mL of wash buffer per gram of pellet. Since the pellet weighed 3 g, the total wash buffer volume was 30 mL. Triton X-100 (0.5 %), a non-ionic detergent, helped solubilise membrane components and remove hydrophobic contaminants. Tris-HCl provided buffer stability and maintained the protein environment during washing.
Resuspended the wash buffer with the inclusion body using a homogeniser at 6000 rpm to ensure thorough mixing and even
distribution.
20m
The mixture was centrifuged at 15000 x g, 4°C, 00:10:00
10m
The supernatant was discarded.
5m
Repeat Steps 62, 63 & 64 once.
25m
The final Inclusion Body pellet was collected and weighed. The weight had reduced slightly to approximately 2.74 grams, reflecting the removal of non-target material.
10m
Solubilisation of Inclusion Bodies
3h
The washed inclusion body pellet (2.74 g) was subjected to solubilization using a chaotropic and reducing buffer system (Solubilisation Buffer).
Buffer Preparation: Solubilisation Buffer (pH 9.0, 50 mL)
| A | B | C | D | |
| Stock | Final Conc. | Volume/Weight Used | ||
| Glycine-NaOH | 1 M | 50 mM | 2.5 mL | |
| Urea | — | 8 M | 24 g | |
| DTT | 1 M | 10 mM | 0.5 mL | |
| EDTA | 0.1 M | 1 mM | 0.5 mL | |
| Milli-Q Water | — | — | To make up to 50 mL |
Table (1.5): Components required to make solubilisation buffer
Note
Urea disrupts hydrogen bonds, thereby unfolding the protein into linear polypeptides. DTT (dithiothreitol) reduces disulfide bridges, ensuring a fully denatured protein. EDTA chelates divalent metal ions (e.g., Mg²⁺, Ca²⁺) that may otherwise catalyse unwanted oxidation. The entire 2.74 g inclusion body pellet was resuspended in 50 mL of solubilization buffer.
30m
The mixture was gently stirred for 02:00:00 at room temperature until complete dissolution of the pellet occurred.
2h
After dissolution, the sample was centrifuged at 15000 x g, 4°C, 00:30:00
30m
The supernatant obtained was taken forward for the sulfitolysis reaction. Discard the pellet
Oxidative Sulfitolysis
3h 20m
Prepare the Sulphitolysis solution
Sulphitolysis Solution (pH 9.0)
| A | B | C | D | |
| Reagent | Stock/Type | Final Conc. | Volume | |
| Sodium sulfite (Na₂SO₃) | 1 M | 200 mM | 10 mL | |
| Sodium tetrathionate | 0.5 M | 20 mM | 2 mL |
Table (1.6): Components required for oxidative sulfitolysis
10m
200 millimolar (mM) of sodium sulfite and 200 millimolar (mM) of sodium tetrathionate was added to the solubilised sample.
10m
Stirred gently at room temperature for 03:00:00 in the dark, as light exposure can degrade tetrathionate.
Note
These processes were essential to preserving the protein’s native conformation during the high-risk refolding stage. Proper buffer design, redox control, and pH maintenance during these steps significantly influenced the success of the final product.
3h
Anion-Exchange Chromatography - FIRST CAPTURE (AEX-1)
3h 45m
Following sulfitolysis, the denatured and chemically stabilised recombinant protein was subjected to a first-stage purification using anion exchange chromatography (AEX).
CHROMATOGRAPHY CONDITIONS
A pre-packed Q-Sepharose Fast Flow column was used for the run. The column was equilibrated with 5 mL column volumes of equilibration buffer at a flow rate of 3 mL/min. UV absorbance at 280 nm. Use NaCl to elute protein bound to the column in a linear gradient manner (Low to High Concentration).
Buffer Preparation: Equilibration Buffer (pH 8.0, 500 mL)
| A | B | C | D | |
| Component | Stock Conc. | Final Conc. | Volume Used | |
| Tris-HCl | 2 M | 50 mM | 12.5 mL | |
| Urea | — | 6 M | 180 g | |
| Milli-Q Water | — | — | To 500 mL |
Table (1.7): Composition of Equilibration Buffer for AEX
Elution Buffer (pH 8.0, 500 mL)
| Component | Stock Conc. | Final Conc. | Volume Used | |
| Tris-HCl | 2 M | 50 mM | 12.5 mL | |
| NaCl | — | 1 M | 29.2 g | |
| Urea | — | 6 M | 180 g | |
| Milli-Q Water | — | — | To 500 mL |
Table (1.8): Composition of Elution Buffer for Anion Exchange
Note
Following sulfitolysis, the denatured and chemically stabilised recombinant protein was subjected to a first-stage purification using anion exchange chromatography (AEX). This step plays a critical role in selectively capturing the sulfonated form of the protein while eliminating excess salts, urea, small molecules, and misfolded or truncated proteins. This chromatographic technique exploits the net negative charge of the sulfonated protein under alkaline conditions, allowing it to bind to a positively charged resin matrix in the column. Proper buffer design and pH optimisation ensured selective binding and efficient elution. In this protocol, the sulfonated recombinant protein (negatively charged at pH 8.0) binds effectively to the column matrix and is eluted using a high-salt buffer.
20m
The sulfonated sample was diluted 10–fold with water in order to stop the sulfitolysis reaction and load onto the column.
10m
Load the column with the sample first, and use the wash buffer (Equilibration Buffer).
Note
Loosely bound impurities were removed by washing with 5 mL column volumes of equilibration buffer
10m
Gradient elution was performed to elute out the bound protein using elution buffer (Linear gradient of NaCl, low to high).
Fractions were collected and monitored using UV absorbance at 280 nm.
Anion-Exchange Chromatogram (AEX-1)
Figure Data (1.6): Chromatogram representing the purification of insoluble sulphonated recombinant protein by Anion-Exchange Chromatography; Y-axis: Absorbance (mAU) 280 nm; X-axis: volume (mL); Column: Q- Sepharose 5 mL
Interpretation: The blue line represents absorbance at 280 nm (UV₁ 280), which correlates with the presence of proteins in the eluate. A sharp and significant peak observed between 470–500 mL indicates the elution of the target insulin protein, which was retained on the column and subsequently eluted under the applied gradient. The orange line (Cond) and green line (Conc B) represent the conductivity and buffer B (elution buffer) concentration, respectively. The sharp insulin peak coincides with a steep increase in elution buffer concentration, suggesting that the protein eluted under high salt, typically consistent with ion exchange, specifically Anion-exchange chromatography purification of inclusion body-derived proteins. This peak confirms successful expression and partial purification of bioactive insulin, which can be further verified by SDS-PAGE.
3h
95 mg of Refolded protein was obtained (Before Digestion)
Note
By performing chromatography, we obtained a curve. We use the area under the curve formula to get a rough idea about the amount of protein (mg) obtained by the chromatography.
5m
SDS-PAGE Analysis of First Capture
50m
SDS-PAGE Condition
Running Buffer: MES (1X)
Running Time: 35 Minutes (Depends on Volts)
Volts: 170 V
Wells: 10 well gel
Loading Dye: Non-Reduced
Gel Type: Pre-Cast (10 %) SDS
L: Load Sample
FT: Flow through Sample
M: Marker
EF1: Elution Fraction 1
EF2: Elution Fraction 2
EF3: Elution Fraction 3
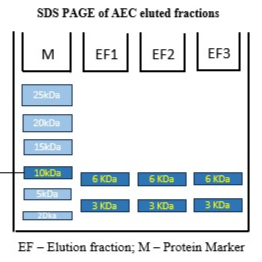
Figure (1.7): SDS-PAGE of purified insoluble sulfonated insulin recombinant protein.
Interpretation: The SDS-PAGE gel shown above depicts the analysis of samples collected from the Anion Exchange Chromatography (AEC-1) purification of sulfonated recombinant insulin expressed in E. coli BL21 (DE3). The gel was run under non-reducing conditions using a 10% pre-cast SDS-polyacrylamide gel with MES running buffer at 170 V for 35 minutes. A prominent protein band is observed in EF1, EF2, and EF3 at approximately 10 kDa, which corresponds to the expected size of sulfonated recombinant insulin. The absence of this band in the flow-through lane (FT) confirms successful retention and binding of the protein to the anion exchange column matrix. Its strong presence in the elution fractions indicates effective elution under high-salt or pH-shifted conditions.
Analysis: This analysis demonstrates that the AEC-1 step was successful in isolating the target protein from the crude lysate. The protein remained in the insoluble/sulfonated form, suitable for downstream refolding and purification processes.
50m
Refolding
2d 0h 40m
Buffer Preparation: Refolding Buffer (pH 9.0, 500 mL)
| Reagent | Stock Conc. | Final Conc. | Volume / Weight Used | |
| Glycine-NaOH | 1 M | 50 mM | 25 mL | |
| NaCl | 5 M | 20 mM | 2 mL | |
| β-Mercaptoethanol | 14.3 M | 0.3 mM | 10.5 µL | |
| Cystine | Solid | 1 mM | 155 mg (Calculated from 46.5 mg/150 mL) | |
| Cysteine | Solid | 5mM | 0.43 g (based on 130 mg/150 mL) | |
| Milli-Q Water | — | — | Adjusted to 500 mL |
Table (1.9): Refolding buffer composition
Note
Dissolve cystine separately because it is insoluble, and gently vortex help to dissolve.
20m
Cystine was dissolved in a separate 15 mL Falcon tube due to its low pH (not really dissolved in pH 9.0) and then added to the refolding buffer.
10m
The eluted sulfonated protein was diluted 10-fold in refolding buffer (Glycine-NaOH).
Note
This step reduces urea concentration and initiates proper folding kinetics.
10m
Incubate the solution at 4-10 °C for 48:00:00
Note
Gentle stirring to allow disulfide reshuffling and protein refolding. Visual turbidity was monitored to detect aggregation. The solution remained mostly clear, indicating successful refolding.
2d
Enzymatic Cleavage
50m
Prepare the Digestion solution
(pH 9.0)
| Enzyme | Dosage (per 8 mg) | For 95 mg of protein | |
| Trypsin | 35 µg | 415.6 µg (approx.) | |
| Carboxypeptidase B | 0.6 µg | 7.05 µg (approx.) |
Table (1.10): Calculations and components required for enzymatic cleavage
10m
Prepare 50 millimolar (mM) Glycine Buffer (pH 10)
10m
Prepare 1 Molarity (M) of NaOH (pH 10)
10m
Add both the component and the make-up to 150 mL of Total Buffer solution)
10m
Add 95 mg Refolded protein to the buffer and add trypsin & carboxypeptidase (pH 10)
10m
Run SDS-PAGE. In this experiment digested gel is shown after the completion of the second capture.
Anion-Exchange Chromatography-(Second Capture)-AEX-II
2h
Chromatography Conditions:
Column used: Q-Sepharose 5 mL;
Absorbance: 280 nm
Buffer Preparation: Equilibration Buffer (pH 10, 500 mL):
| Component | Stock Conc. | Final Conc. | Volume Used | |
| Glycine-NaOH | 1 M | 50 mM | 25 mL | |
| Milli-Q Water | — | — | To 500 mL |
Table (1.11): Composition of Equilibration Buffer for second AEX capture
Buffer Preparation: Elution Buffer(pH 10, 500 mL):
| Component | Stock Conc. | Final Conc. | Volume Used | |
| Glycine-NaOH | 1 M | 50 mM | 25 mL | |
| NaCl | — | 1 M | 29.2 g | |
| Milli-Q Water | — | — | To 500 mL |
Table (1.12): Composition of elution buffer for secondary capture
Figure (1.8): Chromatogram representing purification of renatured recombinant protein after trypsin digestion; Y-axis: Absorbance (mAU) 280 nm; X-axis: volume (mL).
Interpretation: The chromatogram represents the elution profile of the refolded and trypsin-digested recombinant insulin purified using Q-Sepharose (strong anion exchanger, 5 mL column) under a linear salt gradient at pH 10. Absorbance was monitored at 280 nm to track protein content. The blue line (UV 280 nm) indicates the presence and concentration of proteins in the elution profile, while the green line (Conc B) and orange line (Conductivity) represent the increasing concentration of NaCl in Buffer B, which facilitates the elution of negatively charged proteins. A sharp and distinct peak is observed between 650–700 mL, coinciding with the increase in conductivity and salt concentration. This peak corresponds to the elution of the mature insulin protein, which carries a net negative charge at pH 10, allowing it to bind to the Q-Sepharose resin and elute under high-salt conditions. The absence of significant absorbance peaks prior to this region indicates successful washing and removal of non-binding impurities. This confirms that the second AEX capture step effectively isolated the bioactive insulin form after C-chain cleavage and refolding.
2h
SDS-PAGE Analysis of Second Capture (AEX-2)
40m
SDS-PAGE Condition
Running Buffer: MES (1X)
Running Time: 35 Minutes (Depends on Volts)
Volts: 170 V
Wells: 10 well gel
Loading Dye: Non-Reduced
Gel Type: Pre-Cast (10 %) SDS
UD: Undigested Protein
L: Load
FT: Flow Through
M: Molecular Marker
1: Sample 1 of the elution Fraction
2: Sample 2 of the elution Fraction
3: Sample 3 of the elution Fraction
4: Sample 4 of the elution Fraction
5: Sample 5 of the elution Fraction
6: Sample 6 of the elution Fraction
7: Sample 7 of the elution Fraction
8: Sample 8 of the elution Fraction
Figure (1.9): SDS-PAGE (non-reducing) analysis of recombinant insulin before and after trypsin digestion. Prominent band of Digested protein at 6 KDa, whereas band near 9 KDa represents the precursor undigested protein.
Interpretation: The bright, sharp band in lanes 1–8 at the ~6 kDa position confirms successful C-chain cleavage by trypsin and efficient recovery of the mature insulin product. The absence of higher molecular weight bands indicates minimal undigested or aggregated forms, affirming high enzymatic cleavage. efficiency.
40m
Reversed-Phase Chromatography (RPC)- Third Capture - Polishing Step
4h 30m
Buffer Preparation: Equilibration Buffer (pH 4.0, 300 mL)
15m
Buffer Preparation: Elution Buffer (pH 4.0, 150 mL)
| A | B | C | |
| Component | Final Conc. | Notes | |
| TFA | 0.05% | Ion-pairing agent | |
| ACN | 80% | Organic solvent for elution | |
| Milli-Q Water | — | Make up to 150 mL |
Table (1.13): Components required for elution buffer in reverse-phase chromatography
15m
The column was washed with 5–10 column volumes of equilibration buffer to remove any non-retained or weakly bound contaminants.
45m
The digested and purified protein was loaded onto the equilibrated RPC column.
10m
Chromatography Conditions:
X-Axis: Milli-Absorbance at 280 nm
Y-Axis: Volume (mL)
Column: Resource 15; 5 mL
Figure (1.10): Chromatogram showing the loose binding of the target protein to the column. The recombinant protein was obtained in the washing step, which was collected in bulk. The wash sample was then analysed using SDS-PAGE and estimated.
3h
The recovered weight was 11.67 mg of protein
This recovered mass was calculated by the area under the curve from Reverse Phase Chromatography.
5m
SDS-PAGE Analysis of RPC - Third Capture
50m
Samples from Reverse Phase Chromatography were analysed in SDS-PAGE
SDS-PAGE Conditions:
Running Buffer: MES (1X)
Running Time: 35 Minutes (Depends on Volts)
Volts: 170 V
Wells: 10 well gel
Loading Dye: Non-Reduced
Gel Type: Pre-Cast (10 %) SDS
M: Molecular Marker
R.P (N.R): Reverse phase sample (Non-Reducing Dye)
R.P-(R): Reverse Phase Sample (Reducing Dye)
Figure (1.11): SDS-PAGE analysis showing the non-reducing lane (R.P N.R), a single intense band appears between ~5 kDa, representing the folded insulin with intact disulfide bonds between A and B chains. In the reducing lane (R.P R), two bands are clearly visible at approximately 5 kDa and 3 kDa, corresponding to the B chain and A chain, respectively, resulting from complete reduction and cleavage of disulfide bonds.
Interpreation: This band pattern confirms the presence of correctly folded, biologically relevant insulin and the successful cleavage of the C-peptide during trypsin digestion. The shift from one to two bands under reducing conditions validates the disulfide-linked heterodimeric nature of mature insulin.
50m
MASS SPECTROMETRY Analysis & Conformation
1d
Chromatogram of LC-MS (Q-TOF)
X-Axis: Deconvoluted Mass (amu)
Y-Axis: Intensity (Counts)
Figure (1.12): LC–MS deconvoluted mass spectrum of the final purified recombinant insulin. The main peak at 5734.57 Da confirms the expected molecular weight of biologically active insulin following C-peptide removal and correct disulfide bond formation. Minor peaks at 5217.14 Da and 5835.73 Da likely represent byproducts or minor variants. ΔM = –6 Da, indicating high mass accuracy and structural integrity.
Interpretation: The deconvoluted mass spectrum reveals a dominant peak at 5734.57 Da, corresponding precisely to the expected molecular weight of mature human insulin after C-chain cleavage and disulfide bond formation. This peak confirms the successful processing of the insulin precursor into its biologically active heterodimeric form. The observed mass in MS was 5734.57 Da is within a ±6 Da deviation from the theoretical Value, which is acceptable and indicates accurate folding with the correct intra- and inter-chain disulfide linkages. Minor peaks at 5217.14 Da and 5835.73 Da likely represent degradation products or post-translational variants but are negligible compared to the dominant species. The LC–MS results conclusively validate the molecular identity, folding integrity, and purity of the recombinant insulin product.
1d
Lyophilisation (Additional Step)
1d
The recovered weight was 11.67 mg of protein was subjected to lyophilized, also known as freeze-drying.
Note
After achieving the final purified form of the recombinant protein via Reverse Phase Chromatography (RPC), the next step was lyophilisation, also known as freeze-drying. This technique is critical for long-term storage and stabilisation of protein products, especially when they are to be reconstituted later for analytical, formulation, or therapeutic use. Lyophilisation involves the removal of water under low temperature and vacuum, transforming the purified protein solution into a stable, dry powder without causing denaturation or aggregation. Lyophilisation consists of three main steps: Freezing – the sample is frozen below its eutectic point to form ice crystals. Primary Drying (Sublimation) – water is removed in the form of vapour under vacuum. Secondary Drying (Desorption) – remaining bound water molecules are removed to achieve the final dryness. This technique retains the protein’s secondary and tertiary structure and is particularly useful for hydrophobic or aggregation-prone biomolecules. After lyophilisation, the final yield of pure, dry recombinant protein was approximately 11 mg, confirming efficient recovery from 2 L of bacterial culture. This yield reflects cumulative losses during solubilization, refolding, cleavage, and purification, and is considered industrially viable for small-scale therapeutic or research use.
1d
Reconstitution (Additional Step)
40m
Add 1 mg of Recombinant Insulin Protein to an Eppendorf.
10m
Add 250 µL distilled water and then add 0.005 Molarity (M) HCl in the Eppendorf containing the lyophilised protein.
Note
It depends on the respective experimentation on how much concentration to make. In this experiment, the concentration was 1 mg/mL of Recombinant insulin
15m
Once the protein was completely dissolved, the pH was carefully monitored and adjusted to neutral (around pH 7.4) using 5 Molarity (M) of NaOH solution
It depends on the respective experimentation on how much concentration to make. In this experiment, the concentration was 1 mg/mL of Recombinant insulin
15m
DATA INTERPRETATION
11 mg of Recombinant Insulin Protein was purified from 2 L of Culture & the C-Chain was successfully cleaved.