Jun 17, 2025
Version 1
Integrated Workflow for Chromatin Architecture Analysis in Rare Thymic Cells Using Focused Ion Beam Scanning Electron Microscopy V.1
- Zulfeqhar A. Syed1,
- Ye Sun1,
- Mami Matsuda-Lennikov2,
- Yousuke Takahama2,
- Christopher K. E. Bleck1
- 1National Heart, Lung, and Blood Institute (NHLBI), National Institutes of Health, Bethesda, MD, USA;
- 2National Cancer Institute (NCI), National Institutes of Health, Bethesda, MD, USA
- Ye Sun: current affiliation: Carl Zeiss (Shanghai) Co., Ltd., Shanghai, China;
- Christopher K. E. Bleck: current affiliation: Howard Hughes Medical Institute, Janelia Research Campus, Ashburn, VA, USA


Protocol Citation: Zulfeqhar A. Syed, Ye Sun, Mami Matsuda-Lennikov, Yousuke Takahama, Christopher K. E. Bleck 2025. Integrated Workflow for Chromatin Architecture Analysis in Rare Thymic Cells Using Focused Ion Beam Scanning Electron Microscopy. protocols.io https://dx.doi.org/10.17504/protocols.io.bp2l6y5r1vqe/v1
License: This is an open access protocol distributed under the terms of the Creative Commons Attribution License, which permits unrestricted use, distribution, and reproduction in any medium, provided the original author and source are credited
Protocol status: Working
We use this protocol and it's working
Created: May 29, 2025
Last Modified: June 17, 2025
Protocol Integer ID: 219172
Keywords: Thymus, T-cell development, Thymocyte differentiation, Heterochromatin-to-euchromatin ratio, Fluorescence-activated cell sorting (FACS), Alginate hydrogel embedding, Reduced osmium-thiocarbohydrazide-osmium (rOTO) staining, Lead citrate post-staining, Focused ion beam scanning electron microscopy (FIB-SEM), Nuclear architecture, Chromatin remodeling, Rare cell populations, High-resolution 3D imaging, Lymphoid organ, Structural studies, chromatin organisation in cell, chromatin remodelling dynamics in thymic cell, euchromatin ratios among different thymic cell type, chromatin organisation, integrated workflow for chromatin architecture analysis, focused ion beam scanning electron microscopy the thymus, chromatin architecture analysis, exceptional chromatin contrast, euchromatin ratio, rare thymic cell, chromatin remodelling dynamic, thymic cell, different thymic cell type, thymocyte differentiation, traditional electron microscopy, electron microscopy, cell, enriching cell, substantial cell quantity, cell development, scann
Funders Acknowledgements:
Intramural Research Program of the National Institutes of Health, the National Cancer Institute, and the Center for Cancer Research.
Grant ID: ZIA BC 011806
Electron Microscopy Core, National Heart, Lung, and Blood Institute at the National Institutes of Health
Grant ID: 1ZICHL005906-14
Abstract
The thymus, a primary lymphoid organ, plays a critical role in T-cell development and selection including the establishment of central tolerance. To investigate chromatin organisation in cells that regulate thymocyte differentiation, we developed an optimised workflow to quantify heterochromatin-to-euchromatin ratios among different thymic cell types. Traditional electron microscopy (EM) sample preparation methods often require substantial cell quantities, posing challenges for studying rare or low-abundance cells. Our workflow addresses this limitation by enriching cells using fluorescence-activated cell sorting (FACS), followed by chemical fixation and embedding in alginate hydrogel. Samples were then prepared for electron microscopy using a reduced osmium-thiocarbohydrazide-osmium (rOTO) staining protocol, and lead citrate (Walton’s Lead) post-staining provided exceptional chromatin contrast. High-resolution 3D imaging using focused ion beam scanning electron microscopy (FIB-SEM) allowed detailed analysis of nuclear architecture. This approach revealed chromatin remodelling dynamics in thymic cells regulating T-cell development and offered a versatile tool for structural studies of rare cell populations.
Graphical Abstract
Cells are first isolated and enriched using a fluorescence-activated cell sorter (FACS, top left) and then pelleted via centrifugation. The resulting cell pellet is encapsulated by mixing with a 3% sodium alginate solution in PHEM buffer, which is then dropped into PHCM buffer containing 50 mM CaCl₂ and left at room temperature for 1 hour to form an alginate matrix around the cells. The encapsulated cells are then chemically fixed and embedded in resin (top right), producing a polymerized block containing dispersed cells. A region of interest is identified using transmitted light microscopy (middle right), and the block is trimmed to expose individual embedded cells. High-resolution 3D imaging using focused ion beam scanning electron microscopy (FIB-SEM) is performed and 3D-reconstructions (left) are generated from FIB-SEM datasets, highlighting DNA in yellow and the nuclear membrane in blue.
Materials
Buffers and Reagents
- PHEM Buffer: 60 mM Pipes, 25 mM Hepes, 10 mM EGTA, 2 mM MgCl2, pH 6.9.
- PHCM Buffer: 60 mM Pipes, 25 mM Hepes, 1 mM CaCl2, 2 mM MgCl2, pH 6.9.
- Cacodylate Buffer (CB): 0.1 M, pH adjusted as required.
- Sodium Alginate: 3% solution prepared in PHEM buffer.
- Formaldehyde (FA): Used at 4% (w/v).
- Glutaraldehyde (GA): Used at concentrations of 1% and 2.5% (w/v).
- Calcium Chloride (CaCl2): Used at 50 mM.
- Potassium Ferricyanide (K3[Fe(CN)6]): 1.5% (w/v).
- Osmium Tetroxide (OsO4): 2% (w/v) and 4% solutions.
- Thiocarbohydrazide (TCH): 1% (w/v) solution.
- Uranyl Acetate: 1% aqueous solution.
- Walton's Lead Solution: Prepared as described below.
- Ethanol: Graded series from 40% to 100%.
- Epon Resin: Used for embedding.
Walton's Lead Solution Preparation
1. Dissolve 39.9 mg of L-aspartic acid in 10 mL ddH2O, using sonication to aid dissolution.
2. Add 66 mg of lead nitrate while stirring and heating to 60 °C.
3. Adjust pH to 5.5 with freshly prepared 1 M NaOH.
Safety warnings
When working with this protocol involving buffers and reagents, it is essential to be aware of the following warnings to ensure safety and the integrity of your experiments:
PHEM and PHCM Buffers
Both buffers contain Hepes, which can be hazardous if inhaled or ingested. Ensure proper ventilation and handle with care.
Cacodylate Buffer (CB)
Cacodylate is a derivative of arsenic and can be highly toxic. Avoid skin contact and inhalation. Use protective equipment such as gloves and fume hoods.
Sodium Alginate:
Handle the 3% solution with care to avoid splashing. In case of contact with skin, wash immediately with water.
Formaldehyde (FA) and Glutaraldehyde (GA)
Both are potent fixatives and can be harmful if inhaled or if they come into contact with skin. Use only in a well-ventilated area or fume hood, and wear appropriate personal protective equipment (PPE), including gloves and goggles.
Calcium Chloride (CaCl2)
Can cause irritation to skin and eyes. Handle with care and wash any areas of contact thoroughly.
Potassium Ferricyanide (K3[Fe(CN)6])
Although generally considered low risk, avoid prolonged exposure. Dispose only under safe chemical conditions as it can release toxic gases.
Osmium Tetroxide (OsO4)
Extremely toxic and volatile. Always handle in a fume hood with full PPE, including a respirator if necessary. Osmium tetroxide fumes can severely damage eyes and respiratory tract.
Thiocarbohydrazide (TCH)
Handle with care to avoid contact with skin and eyes. Use protective gloves and wash hands thoroughly after use.
Uranyl Acetate
As a radioactive substance, handle with extreme caution following your institution's safety guidelines for radioactive materials. Use in designated areas.
Walton’s Lead Solution
Lead compounds are toxic. Minimize exposure by handling in a fume hood and wearing appropriate PPE.
Ethanol
Highly flammable. Keep away from heat or flame and use in a well-ventilated area.
Epon Resin
May cause skin and eye irritation. Use gloves and goggles while handling.
General Handling
Ensure to dispose of all hazardous materials according to your institutional waste disposal procedures. Regularly check and maintain safety equipment and PPE for effectiveness.
Ethics statement
All mouse experiments were performed under the approval of the Animal Care and Use Committee of the National Cancer Institute (ASP21-431 and EIB-076).
Day 1: Cell Encapsulation and Fixation
Primary Fixation: Sorted cells (typically 10,000 – 20,000 cells) were initially fixed in a solution of 4% formaldehyde and 1% glutaraldehyde in PHEM buffer. The cells were then centrifuged at 200 RCF (Relative Centrifugal Force, g-force) for 15 minutes, and the supernatant was removed.
Alginate Encapsulation: A 3% sodium alginate solution in PHEM buffer was added to the cell pellet. The mixture was subsequently dropped into PHCM buffer containing 50 mM CaCl2 and allowed to stand at room temperature for 1 hour to encapsulate the cells within the alginate matrix.
Secondary Fixation: The encapsulated cells were transferred to a 2.5% glutaraldehyde and 1% formaldehyde solution with 50 mM CaCl2 in cacodylate buffer and incubated at 4 °C overnight.
Day 2: Staining and Washing
Buffer Washing: Following the overnight fixation, samples were washed with 0.1 M cacodylate buffer containing 50 mM CaCl2 for 3 minutes each, repeated five times.
Ferricyanide and Osmium Tetroxide Staining: The samples were stained with 1.5% potassium ferricyanide and 2% osmium tetroxide in cacodylate buffer with 50 mM CaCl2. Staining was performed in the dark, on ice, for 1 hour, followed by water washes (3 minutes each, repeated five times).
Thiocarbohydrazide Staining: Samples were stained with 1% thiocarbohydrazide for 20 minutes at room temperature, then washed with water (3 minutes each, five times).
Second Osmium Tetroxide Staining: 2% osmium tetroxide in water was stained for 30 minutes on ice in the dark. Subsequently, samples were washed with water (3 minutes each, five times).
Uranyl Acetate Staining: Samples were incubated in 1% aqueous uranyl acetate at 4 °C overnight.
Day 3: Further Staining and Dehydration
Washing with Cold Water: Samples were washed with cold water for 3 minutes each, five times, with a final wash at 60 °C.
Walton's Lead Staining: Staining was carried out using Walton's lead solution at 60 °C for 30 minutes, followed by washing with 60 °C water for 3 minutes each, repeated five times.
Ethanol Dehydration: Samples underwent a graded ethanol dehydration series (if 30% (very quick), 50%, 70%, 80%, 90%, and 95% for 5 minutes each) followed by two washes in 100% ethanol for 5 minutes each.
Epon Infiltration: Samples were infiltrated with increasing concentrations of Epon resin in ethanol: 25% Epon for 1 hour, 50% Epon for 2 hours, and 75% Epon overnight.
Day 4: Embedding
Final Epon Infiltration: Samples were infiltrated with 100% Epon for 3 hours, followed by 1.5 hours, and then 2 hours.
Sample Mounting and Polymerization: Samples were mounted on stubs, with excess resin removed using filter paper. A small drop of resin was added to the stub before placing the sample. Polymerization was completed in a 60 °C oven for 2 days, preferably under vacuum.
Imaging and Segmentation
Following sample preparation, imaging is performed using focused ion beam-scanning electron microscopy (FIB-SEM) under established operating conditions optimized for your specific application. The choice of imaging parameters — including beam current, voltage, dwell time, and voxel resolution — should be guided by prior experience or institutional best practices to maximize contrast and structural preservation. Depending on the instrumentation available, both commercial systems and in-house optimized setups can be used to acquire high-resolution volumetric datasets suitable for downstream segmentation and analysis.
Segmentation of cellular or subcellular structures can be carried out using a variety of software platforms. User-friendly graphical interface–based tools such as ilastik, Dragonfly 3D World, Thermo Scientific Amira, ZEISS arivis, and Scalableminds WEBKNOSSOS allow for interactive segmentation, while more advanced users may choose to develop custom segmentation pipelines. Deep learning approaches — implemented using libraries like PyTorch, TensorFlow, or Keras — offer powerful alternatives for automated and scalable segmentation, particularly for large or complex datasets. The choice of method should be guided by the complexity of the structures, availability of training data, and desired level of segmentation accuracy.
Following segmentation, 3D reconstruction of the labeled structures can be performed to facilitate spatial analysis and quantitative measurements. Visualization platforms like Imaris or Napari allow for interactive exploration, rendering, and annotation of segmented volumes. Manual refinement or curation of segmentations can be carried out as needed to correct artifacts or improve accuracy before quantitative analysis.
Representative Results
Chromatin located within the cell nucleus is organized into two principal forms: heterochromatin and euchromatin. Heterochromatin is characterized by its dense packing and appears as darkly staining regions when observed under an electron microscope. This form of chromatin is generally transcriptionally inactive or exhibits reduced activity. Conversely, euchromatin is more loosely structured, exhibits a lighter staining pattern, and is associated with regions of active transcription.The ratio of heterochromatin to euchromatin within a cell's nucleus serves as a significant indicator of transcriptional activity. A higher ratio (greater than 1) signifies a transcriptionally inactive or more repressed state, whereas a lower ratio (less than 1) indicates heightened transcriptional activity. In thymic tissue, three distinct cell types can be differentiated based on their chromatin organization:
1. Thymocytes typically exhibit a high heterochromatin/euchromatin ratio and an elevated total chromatin volume, reflecting their low transcriptional activity.
2. Medullary thymic epithelial cells demonstrate an intermediate ratio and chromatin volume.
3. Cortical thymic epithelial cells portray the lowest heterochromatin/euchromatin ratio alongside intermediate chromatin volume, suggesting that they are the most transcriptionally active of the three cell types.
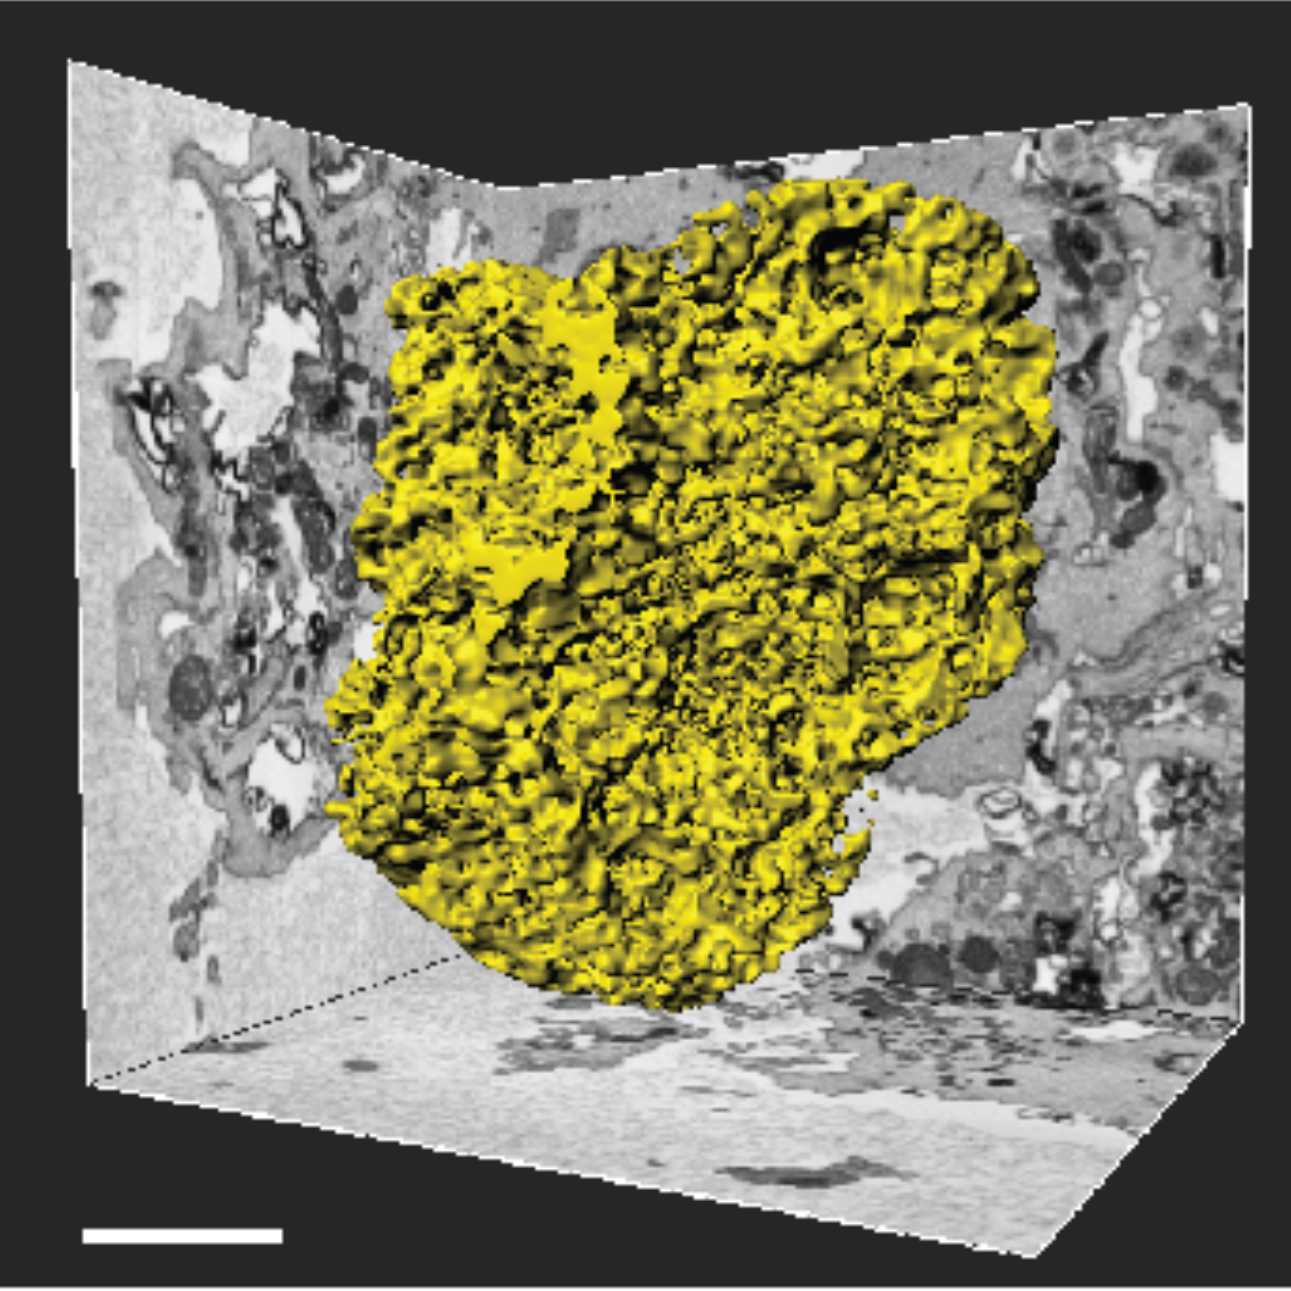
The experimental visualization and quantification of chromatin states can be accomplished using volume microscopy techniques (FIB-SEM). As depicted in the reference image in the protocol, heterochromatin appears as condensed, irregular particles situated adjacent to the nuclear envelope and dispersed throughout the nucleus, while euchromatin is more diffuse and less readily stained. This protocol delineates methodology for comparing chromatin structure of low abundance thymic cell types, employing imaging and quantification strategies. A thorough understanding of these distinctions facilitates the correlation of chromatin organization with cell function and transcriptional activity within the thymus.
Representative electron microscopy images showing nuclear chromatin organization in medullary thymic epithelial cells. Segmentation masks were generated using ilastik pixel classification to distinguish heterochromatin (dense regions) from euchromatin (lighter regions).
Heterochromatin/Euchromatin Ratio Across Thymic Cell Types.
Box-and-whisker plots are used to illustrate the distribution of the heterochromatin/euchromatin ratio across various thymic cell populations. The data is presented for different cell types: thymocytes (in blue), double-positive (DP) thymocytes (in red), medullary thymic epithelial cells (in green), MHC-II-high medullary thymic epithelial cells (in light green), MHC-II-low medullary thymic epithelial cells (in yellow-green), and cortical thymic epithelial cells (in grey). The y-axis is displayed on a logarithmic scale. Each data point represents the three-dimensional nuclear volume of an individual cell, analyzed in relation to both euchromatic and heterochromatic regions. Thymocytes and DP thymocytes demonstrate higher heterochromatin/euchromatin ratios compared to all subsets of thymic epithelial cells, with cortical thymic epithelial cells exhibiting the lowest ratio.
The protocol consistently yielded high-resolution nuclear images with clearly distinguishable chromatin domains. When applied to thymic tissue, enabled reliable identification and quantification of heterochromatin and euchromatin regions within distinct cell populations. Quantitative analysis showed reproducible hetero/euchromatin ratios across multiple biological replicates, we noted that cortical thymic epithelial cells displayed a moderately high hetero/euchromatin ratio in comparison with thymocytes including double-positive (DP) CD4+CD8+ thymocytes. In contrast, medullary thymic epithelial cells showed a notable variability, suggesting a functional diversity within this group. These results underscore diverse chromatin structures and suggest varying functional roles across different thymic cell populations. Chromatin dynamics during immune cell differentiation, the development and diversity of thymic epithelial cell architecture have been well characterized in prior studies, (Winter & Amit, 2014; Takahama et al., 2017), support these findings by highlighting the link between chromatin state and cellular differentiation within the immune system.
Protocol references
1. Sabatini, D. D., Bensch, K. & Barrnett, R. J. CYTOCHEMISTRY AND ELECTRON MICROSCOPY. J. Cell Biol. 17, 19–58 (1963).
2. Hulett, H. R., Bonner, W. A., Barrett, J. & Herzenberg, L. A. Cell Sorting: Automated Separation of Mammalian Cells as a Function of Intracellular Fluorescence. Science 166, 747–749 (1969).
3. Schliwa, M., Euteneuer, U., Bulinski, J. C. & Izant, J. G. Calcium lability of cytoplasmic microtubules and its modulation by microtubule-associated proteins. Proc. Natl. Acad. Sci. 78, 1037–1041 (1981).
4. Draget, K. I., Østgaard, K. & Smidsrød, O. Homogeneous alginate gels: A technical approach. Carbohydr. Polym. 14, 159–178 (1990).
5. Deerinck, T. J., Bushong, E. A., Thor, A. & Ellisman, M. H. NCMIR methods for 3D EM: A new protocol for preparation of biological specimens for serial block face scanning electron microscopy. 6–8 (2010).
6. Winter, D. R., & Amit, I. 2014. The role of chromatin dynamics in immune cell development. Immunological
Reviews, 2611, 922.
7. Takahama, Y., Ohigashi, I., Baik, S., & Anderson, G. 2017. Generation of diversity in thymic epithelial cells.
Nature Reviews Immunology.
8. Walton J. Lead asparate, an en bloc contrast stain particularly useful for ultrastructural enzymology. Journal of Histochemistry & Cytochemistry. 27(10):1337-1342 (1979)
Acknowledgements
We would like to extend our sincere gratitude to Eric Lindberg from the National Institutes of Health, National Heart, Lung, and Blood Institute, Chemistry and Synthesis Center in Rockville, MD, for his invaluable assistance in initiating the protocol for our research. His expertise and guidance were instrumental in setting the foundations for our study, and we deeply appreciate his support and contribution to our work.