Aug 02, 2025
Identification of phage lysis from environmental samples based on 96-well plate screening
- Anna Golikova1,
- Alexandra Stiffler1,
- Cynthia Silveira1
- 1University of Miami


Protocol Citation: Anna Golikova, Alexandra Stiffler, Cynthia Silveira 2025. Identification of phage lysis from environmental samples based on 96-well plate screening. protocols.io https://dx.doi.org/10.17504/protocols.io.dm6gp9898vzp/v1
License: This is an open access protocol distributed under the terms of the Creative Commons Attribution License, which permits unrestricted use, distribution, and reproduction in any medium, provided the original author and source are credited
Protocol status: Working
Created: October 31, 2024
Last Modified: August 02, 2025
Protocol Integer ID: 111361
Keywords: bacteriophage, isolation, host-phage pair identification, spectrophotometer, virus, optical density, marine, environmental, identification of phage lysi, phage lysi, screening of bacterial isolate, proxy for bacterial growth, bacterial isolate, potential viral lysi, bacterial growth, lysis from environmental sample, bacterial culture, single phage colony, multiple rounds of plaque isolation, plaque isolation, decrease in bacterial growth, using spot assay, containing viral particle, spot assay, viral particle, induced lysi
Funders Acknowledgements:
National Science Foundation
Grant ID: 2424579
National Aeronautics and Space Administration
Grant ID: 80NSSC23K0676
National Science Foundation
Grant ID: 2023349872
Abstract
This protocol is an optical density-based screening of bacterial isolates for bacteriophage-induced lysis from environmental samples (seawater, soil suspensions in buffer, etc.). It compares the optical density at 600 nm (OD600; proxy for bacterial growth) of a bacterial culture inoculated with a concentrated viral community and controls. Potential viral lysis is indicated by a decrease in bacterial growth upon the addition of an environmental sample containing viral particles, which is confirmed through plaque and spot assays. A single phage colony consistently infecting its host is purified and isolated via multiple rounds of plaque isolation using spot assays and the double-layer agar method.
Image Attribution
Anna Golikova
Materials
For preparation of viral concentrates from seawater using VivaFlow:
- Sartorius Vivaflow™ 200 Crossflow Cassette 100kDa (Satorius CAT# VF20P4)
- Masterflex® L/S® Analog Variable-Speed Console Drive, 7 to 200 rpm; 115 VAC (Masterflex® CAT# MFLX0755500)
- Masterflex® L/S® Easy-Load® Heads for Precision Tubing, 4-Roller, PARA Housing, SS Rotor (Masterflex® CAT# MFLX0751410)
- Masterflex® L/S® Easy-Load Pump Head Mounting Hardware (Masterflex® CAT# MFLX0701305)
- Masterflex® L/S® Precision Tygon® E-Lab (E-3603) Pump Tubing (Masterflex® CAT# MFLX0650916)
- 8 µm pore size, 25 mm flat filter (Whatman™, Nucleopore Track-Etched Polycarbonate CAT# 110614)
- 0.45 µm pore size Sterivex™ pressure filter, PVDF membrane (Millipore® CAT# SVHV01015)
- Male Luer Lock 1/8" 3.2mm PP Hose Barb Adapter (Amazon CAT# B07W5S4728)
For optical density screening:
-Equipment:
- Synergy H1MD Hybrid Reader (BioTek)
-Materials:
- Glycerol stocks of bacterial isolates
- Millex™ PVDF syringe filter, 0.22 µm pore size, 33 mm diameter (Millipore® CAT# SLGVR33RS)
- Anotop 25 mm syringe filter, 0.02 µm pore size (Whatman™ CAT#6809-2002)
- GenClone® Cell Culture Plates, 96-well Round (U-well) (Genesee Scientific CAT# 25-221MP)
- Clear Polyester Thin Cold Sealing Film with Adhesive Backing, 0.05 mm thick (Whatman™ CAT# 7704-0001)
- Marine Broth 2216 (MB) (BD Difco™ CAT# 279110)
- Deionized water (DI H2O)
- Agar (Fisher BioReagents™ CAT# BP1423-500)
- Mono Petri Dishes, 100 x 15 (VWR® CAT# 25384-342)
- Reef Crystals Reef Salt (Instant Ocean® CAT# AQ-RC1160P-10)
- Chloroform (Fisher Chemical™ CAT#C298-500)
- 1.5 mL Eppendorf tubes
- 5 mL glass test tubes
- 15 mL conical centrifuge tubes
Before start
Preparation of viral community stock:
For seawater viral particle concentration, please refer to the "Seawater virome concentration with Vivaflow" protocol (available at dx.doi.org/10.17504/protocols.io.ewov1qdopgr2/v1) for full details on Vivaflow setup, virome collection, and concentration.
In summary,
- Collect 6 L of seawater
- Using the Masterflex® peristaltic pump, sequentially filter the seawater through an 8 μm flat filter and a 0.45 μm Sterivex™ filter.
- Concentrate the filtrate to 50-100 mL using a 100 kDa Vivaflow™ tangential flow filtration (TFF) cassette.
- Store the concentrated viral community stock at 4 °C with 0.5% chloroform.
For viral particles from other environments, such as soils, sediments, and host-associated samples, other methods will be necessary to dislodge and concentrate viral particles. Please adapt as necessary.
Prepare media:
This protocol was optimized for marine bacteriophages, so it uses media commonly applied to marine bacteria. Adapt as necessary depending on the nature of the environmental sample.
Sterile liquid marine media (marine broth [MB]):
- Dissolve 37.4 g of Difco™ Marine Broth powder into 1 L of DI H2O and mix.
- Autoclave at 121 °C .
- Cool down to Room temperature before use.
1.5 % marine agar [MA] plates:
- Dissolve 37.4 g of Difco™ Marine Broth and 15 g of agar into 1 L of DI H2O.
- Stir for 01:00:00 at Room temperature .
- Autoclave at 121 °C .
- Sterilely pour 25 mL of MA into each sterile petri dish and leave Overnight to solidify.
- Store inverted 1.5% MA plates at 4 °C until in use.
0.7 % top agar [TA]:
- Dissolve 37.4 g of Difco™ Marine Broth and 7 g of agar into 1 L of DI H2O.
- Autoclave at 121 °C .
- Store in a 55 °C water bath or at Room temperature and re-autoclave before use.
0.02 µm-filtered 3.3% artificial seawater [ASW]:
- Mix Reef Crystals Reef Salt with DI H2O to prepare 3.3% (wt/vol) solution.
- Stir vigorously for 01:00:00 at Room temperature .
- 0.02 µm syringe filter the solution.
Identification of putative lysis of isolated bacteria by a viral community stock
3d
Day 1. Preparation of bacterial inoculum in a 96-well plate:
The procedure below describes how to reactivate bacterial isolates from their glycerol stocks on a 96-well plate the day before the optical density screening for phage lysis.
You can screen up to 47 isolates at a time because the 96-well plate will be split into two sides, one side for inoculation of viral concentrate and the other with bacteria only as a reference, plus at least one blank well. The map in Step 2 describes the screening of 40 isolates, with one blank well (media only), and the remaining two columns in the plate left empty. Note there are no replicates in this case. If replicates are desired at this stage, just decrease the number of isolates screened per plate.
The timeframe described here works well for relatively fast-growing bacteria, such as Vibrio, Alteromonas, Pseudoalteromonas, etc, which display visible growth in 24 hours.
1d
Add 200 µL of Marine Broth (MB) to each well of a 96-well plate (Plate #1).
Add 10 µL of a glycerol stock of each bacterial isolate to its appropriate well on Plate #1. Make a map of the plate with isolate IDs using a template map, such as this: https://tools.thermofisher.com/content/sfs/brochures/cms_039767.pdf
Incubate Plate #1 at 200 rpm, 23°C (rotations per minute; room temperature) Overnight .
Day 2-3. Preparation of experimental 96-well plate for optical density screening:
The procedure below describes how to set up a 96-well plate with bacterial isolates, viruses, and a control to screen for changes in bacterial growth due to potential viral infection.
Plate #2 - is used to create a 1:20 dilution of overnight bacterial cultures from Plate #1 (prepared in step 1.3).
Plate #3 - is used to create another 1:20 dilution of bacterial cultures from Plate #2. Resulting bacterial cultures on Plate #3 are diluted 1:400 compared to their initial overnight cultures from Plate #1. This step ensures that bacterial inocula enter log phase of growth and are most likely to be susceptible to viral infections, if any. Plate #3 is divided into two parts: "bacteria only" treatment (left side of the plate in the picture below) and "bacteria + virus" treatment (right side of the plate in the picture below).
Plate #3 can be set up with replicates per each bacterial isolate, if desired, starting with the same isolate culture from Plate #2.
For initial screening of a bacterial isolate for susceptibility to viral infections, you can skip replicates and screen a large number of isolates (one "bacteria only" well and one "bacteria + virus" well per bacterial isolate). However, using replicates for each treatment will allow to perform statistical tests later to analyze whether bacterial growth decreased significantly in the "bacteria + virus" treatment compared to the "bacteria only" treatment.
Fig. 1 | Set up of three 96-well plates: plate #1 (to reactivate bacterial glycerol stocks), plate #2 (dilution plate), plate #3 (second dilution plate and experimental plate used for optical density measurements). Created in BioRender. Silveira, C. (2025) https://BioRender.com/7xg6l1i
2d
Add 190 µL of MB to each well of a new 96-well plate (Plate #2).
Add 180 µL of MB to each well of another 96-well plate (Plate #3). Plate #3 will be split into two halves.
Dilute each bacterial isolate by transferring 10 µL of the overnight bacterial culture (from Plate #1) to each corresponding well on Plate #2, and carefully mix by pipetting.
Inoculate Plate #3 with 10 µL of bacterial culture from corresponding wells in Plate #2.
To each well in the left side of Plate #3 ("bacteria only"), add 10 µL of Artificial Seawater (ASW) or the same buffer where the viral particles are suspended.
To each well in the right side of Plate #3 ("bacteria + virus") add 10 µL of the viral community stock. OPTION to wait until bacteria grow for a few hours before adding viral concentrates and buffers.
Add 200 µL of MB to a single well on Plate #3 as a control.
Cover Plate #3 with a lid.
Optional: instead of a lid, cover Plate #3 with a sealing film to prevent liquid evaporation from wells. Note that covering 96-well plate with the film could lead to oxygen deprivation of bacterial cultures.
Using the Synergy H1MD Hybrid Reader (or other available plate reader), record the optical density of Plate #3 at wavelength 600 nm (OD600) every 30 minutes or every hour for 24:00:00 hours at Room temperature and continuous shaking.
Compare the generated growth curves of isolates inoculated with (right side of Plate #3) and without (left side of Plate #3) viruses:
- Download the OD600 readings (if available, you can use OD600 values that have already been discounted from blank (control) OD600 values) as an Excel or CSV file and save it on your computer.
- Use a publicly available program (such as "Dashing Growth Curves" http://dashing-growth-curves.ethz.ch/ or "Welly" https://synbioexplorer.pythonanywhere.com/) or a custom code in R or Python to compare the area under the curve between "bacteria only" and "bacteria + virus" treatments. NOTE: different programs might require different formatting of Excel or CSV files with OD600 data (column names, etc).
- Select the bacterial isolates showing a reduction of area under the growth curves in "bacteria + virus" treatment compared to "bacteria only". If using replicates for each treatment, perform a statistical test (e.g., unpaired two-sample t-test) to determine if the difference in area under the curves between two treatments is significant. If no replicates are available, assess how different the treatment curves are for each isolate (e.g., two-fold) and decide whether to subject that isolate to further testing (see step 3. Day 4. Plaque assay).
On Plate #3, identify "bacteria + virus" wells with bacterial growth reduction due to putative inoculation with viruses. These wells might contain potential host-phage pairs that need confirmation.
Collect the contents of each selected "bacteria + virus" well with a potential host-phage pair on Plate #3 into a microcentrifuge Eppendorf tube. Centrifuge at 10000 rcf, 00:15:00 Room temperature to pellet down bacterial cells and cell debris. Save the supernatant (potential viral enrichment) in a new labeled Eppendorf tube. Add 0.5% chloroform (note that this will select for certain types of phages, and exclude those with chloroform-sensitive capsids). Store at Room temperature until plaque assay (Day 4. Plaque assay).
This is a potential pause point. Potential viral enrichment (collected in step 2.12) can stay in the fridge for a couple of days for most phages. However, we recommend proceeding immediately to Day 4. Plaque assay to confirm that changes in the bacterial growth in "bacteria + virus" treatment occurred due to the infection.
Prepare bacterial culture for the next step: Inoculate a 3 mL MB culture of the bacterial isolate (from glycerol stock) that is a potential host at 200 rpm, 23°C Overnight or until the culture is in log-phase, and proceed to Day 4. Plaque assay.
Confirmation of potential host-phage pairs (shown for one pair)
2d
Day 4. Plaque assay:
The procedure below describes how to perform a plaque assay to manually confirm infectivity of potential viral enrichment (collected in 2.12) against bacterial isolates (selected in step 2.10). Upon observation of confirmed infection, a single phage plaque is collected in Day 5. Plaque elution for further purification in Day 6. Spot assay and Day 7. Spot assays. Phage purification.
1h
Preheat a labeled MA plate at 37 °C for 00:30:00 . This will prevent the top agar from completely solidifying when you start pouring.
Add 3 mL of warm (55 °C ) top agar to an empty and sterile 5 mL test tube.
Add 300 µL of the bacterial inoculum of the potential host (prepared in step 2.14) to the test tube with top agar.
Add 100 µL of the collected potential viral enrichment (prepared in step 2.12) to the test tube with top agar and bacteria. Immediately proceed to the next step before the top agar cools down and starts to solidify.
Quickly rotate the test tube between palms to mix. Be careful not to spill any contents of the tube.
Pour the test tube contents on a warm MA plate. Avoid making bubbles in a top agar. Carefully swirl the plate on the table surface to evenly distribute the liquid across the whole plate.
Incubate the MA plate (do not invert the plate) at Room temperature on the benchOvernight for plaque formation. Check for appearance of plaques on MA plate the next day. If plaques are present, proceed to Day 5. Plaque elution.
NOTE: different viral plaques/phages take different time to appear on a plate after plaque or spot assays (time varies from 10-12 hours to a few days). If working with unknown viruses, monitor the plate appearance regularly (every few hours) and over the span of a few days (up to one week, if needed).
Day 5. Plaque elution (if MA plate has plaques):
The procedure below enables elution of a single separated plaque from a plaque/spot assay. If a MA plate has multiple plaques of different morphology, elute multiple plaques separately (these plaques might have originated from different viruses).
2h
Aseptically insert a sterile pipette tip into the center of a single plaque on MA plate. Select the size of pipette tip based on the size of the plaque to be eluted.
Suspend the plaque by inserting the tip into 500 µL of ASW in a new Eppendorf tube and pipetting up and down a few times.
Using the same tip as in step 4.1, insert it in a center of a just poked plaque, stab the spot a few times, and then re-suspend leftovers of a collected plaque in the same Eppendorf tube as used in step 4.2. Repeat this step for 2-3 times for each eluted plaque to ensure that the whole plaque is collected in one Eppendorf tube.
Leave the Eppendorf tube undisturbed for 00:30:00 min - 01:00:00 to diffuse phage into the solution. Tap in the tube every now and then during the incubation to help release the phage into ASW.
Centrifuge Eppendorf tube at 21130 rcf, 23°C , 3 min to collect agar at the bottom of the tube.
Move the supernatant to a fresh Eppendorf tube (this is a putative viral stock). Add chloroform at 0.5% final concentration (Note that chloroform will select for certain phages). Store at 4 °C .
This is a potential pause point. Putative viral stocks can stay in the fridge for a couple of days for most phages.
Prepare bacterial culture for the next step: for each eluted plaque, inoculate 3 mL MB culture of the bacterial isolate (potential host) at 200 rpm, 23°C Overnight or until in log-phase and proceed to Day 6. Spot assay.
Verification of consistent reinfection in the host-phage pair
1d
Day 6. Spot assay (shown for one eluted plaque in Day 5):
The procedure below confirms infection of a bacterial isolate with a phage (eluted in step 4.6) and isolation of a single phage colony.
Tube #1 - is used to dilute the concentrated bacterial overnight culture (prepared in step 4.8) and bring the culture back to log-phase for the spot assay.
Tube #2 - is used to amplify phage during the log-phase growth of its host and obtain a high phage yield.
1d
Split 3 mL of the bacterial inoculum (prepared in step 4.8) in half into two test tubes. To tube #1, add 1.5 mL of MB. To tube #2, add 100 µL of phage elution (putative viral stock from step 4.6) and 1.4 mL of MB.
Inoculate both tube #1 and tube #2 at 200 rpm, 23°C 05:00:00 hours - 06:00:00 hours .
NOTE: This step may take different times (less or more than 5-6 hours) depending on the host growth rate and the phage replication time. You can estimate this time based on the previously obtained plate reader results (time it takes for the curve to drop to approximately 2/3 of the maximum growth value in "bacteria+virus" treatment).
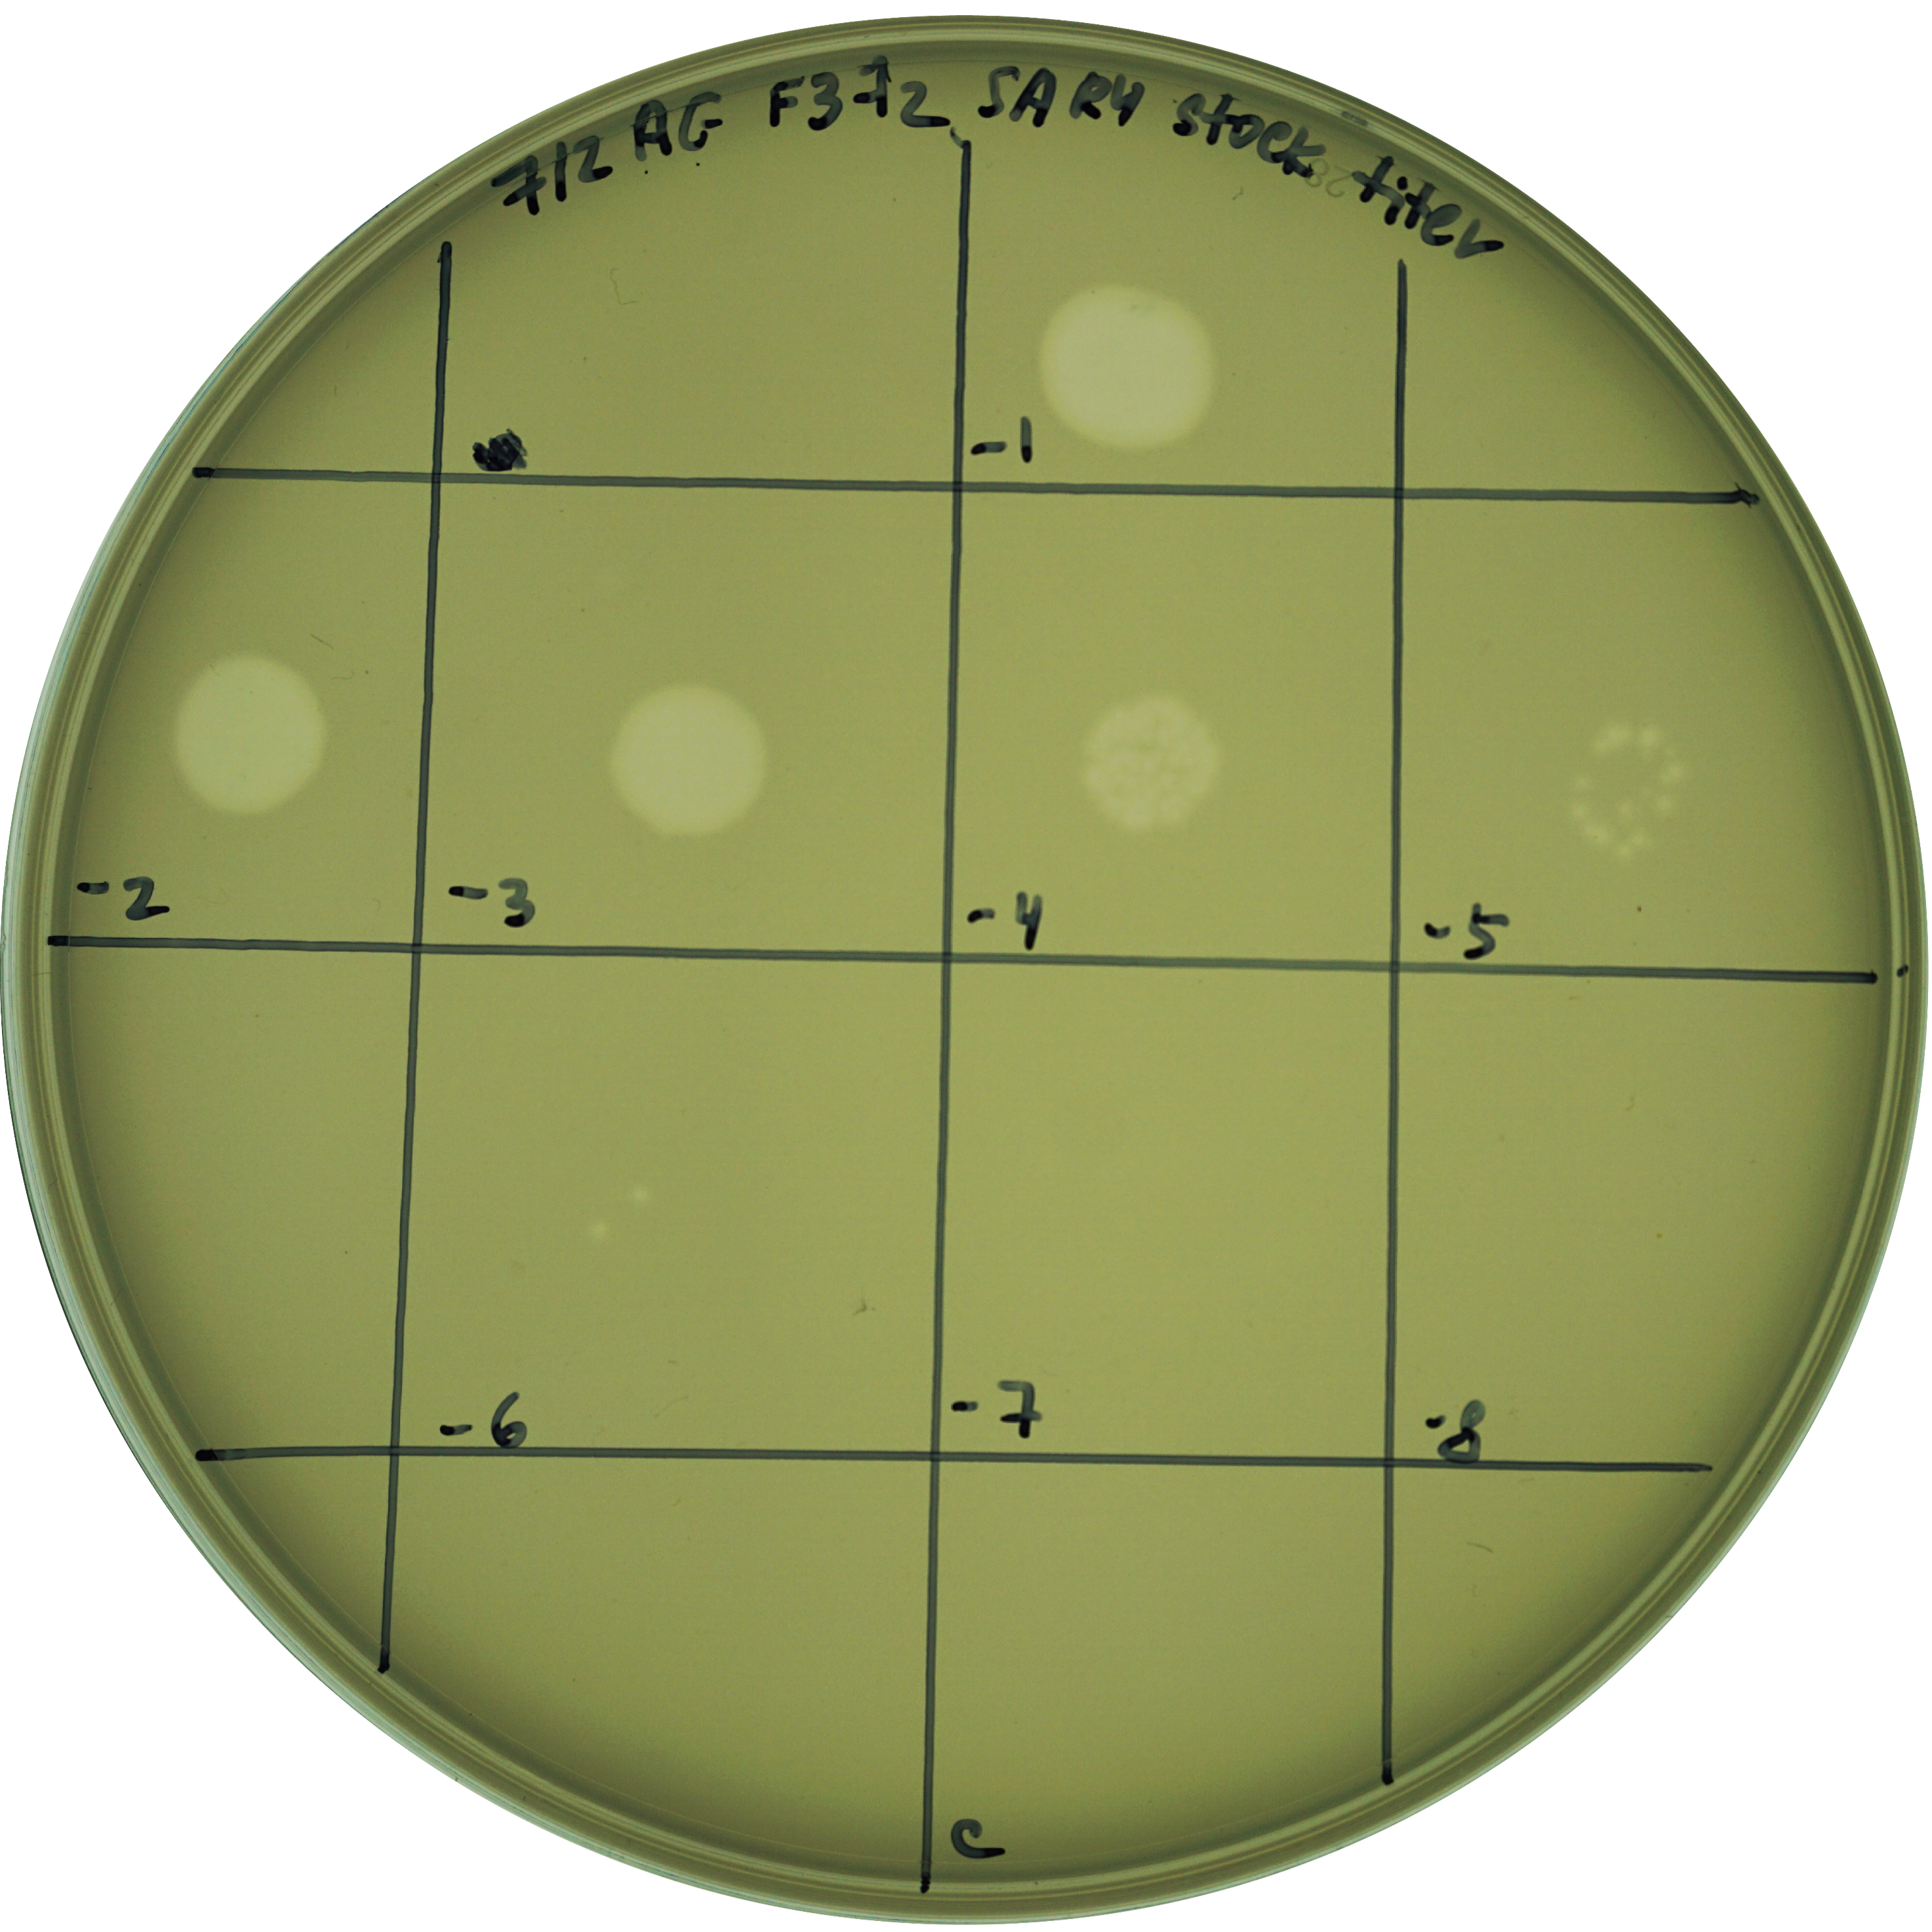
During inoculation time, draw a grid on a MA plate (See picture in step 5.10). Label slots in the grid with dilutions 100 to 10-8 and "c" for "control". Preheat a labeled MA plate at 37 °C for 00:30:00 .
When step 5.2 is completed, pellet down bacterial cells and cell debris by transferring tube #2 contents to a 5 mL centrifuge tube and centrifuging at up to 10000 rcf for 00:30:00 at Room temperature (recommended).
If a rotor for that speed and volume is not available, use a 15 mL centrifuge tube and centrifuge at max speed (3234 rcf or faster) for 00:30:00 at Room temperature .
While centrifuging, prepare a host lawn for the spot assay: add 3 mL of top agar and 300 µL of tube #1 culture to a new sterile 5 mL test tube.
Quickly rotate the test tube between palms to mix. Be careful not to spill any contents of the tube. Immediately proceed to the next step before the top agar cools down and starts to solidify.
Pour the test tube contents on a warm MA plate. Avoid making bubbles in a top agar. Carefully swirl the plate on the table surface to evenly distribute the liquid across the whole plate. Let the top agar layer solidify on a bench for at least 00:30:00 minutes .
When centrifuging is done, transfer the supernatant (viral lysate) to a new 15 mL or 5 mL centrifuge tube. This is your new 100 viral stock.
Make 10-1 to 10-8 serial dilutions of the 100 viral stock in Eppendorf tubes: using a new pipette tip, transfer 10 µL of a previous dilution into 90 µL of ASW (or other appropriate buffer) in a new tube (next dilution); pipette up and down x20 times; switch the tip to a new one and transfer 10 µL of each dilution into 90 µL of ASW for the next dilution. Repeat consecutive serial dilutions until 10-8 dilution is reached.
NOTE: Adjust the number of serial dilutions (lower than 10-8) if information on the viral stock titer is known in future experiments.
Spot 5 µL of each viral dilution onto its respective place on a pre-labeled grid of the solidified MA plate. Spot 5 µL of ASW in a single place on the grid as a "control" spot to ensure absence of contamination in the ASW used for making serial dilutions of the 100 viral stock.
Fig. 2 | Example of a spot assay plate with gradually decreasing plaque concentration toward lower dilutions (10-1 - 10-6).
Incubate the plate (do not invert the plate) at Room temperature for 24:00:00 hours . Check for appearance of single plaques in lower dilutions. Record the number of PFUs (plaque forming units) in the dilutions where single plaques can be observed. Calculate the titer (PFU/mL) of 100 viral stock by accounting for the volume plated (in this case, 5 µL ).
NOTE: different viral plaques/phages take different times to appear on a plate after plaque or spot assays (time varies from 10-12 hours to a few days). If working with unknown viruses, monitor the plaque appearance regularly (every few hours) and over the span of a few days (up to one week, if needed).
Elute single distinct plaques according to procedures in step 4.
This is a potential pause point. Viral stocks obtained from eluted plaques after spot assays can stay at 4 °C for prolonged time depending on the phage. Parafilmed MA plates with plaques can stay at 4 °C for a few weeks and other intact single plaques can be eluted, if needed.
Phage purification
4d
Day 7. Spot assays. Phage purification:
The procedure below ensures phage purification via repeated isolation of a single phage colony in multiple rounds of spot assays.
4d
Repeat steps 4 and 5: perform multiple consecutive rounds (3-5) of spot assays to purify and isolate a single phage colony. In each new round, use a phage elution obtained in the previous round to prepare 100 viral stocks for serial dilutions and the original glycerol stocks of the host.
Upon obtaining 100 viral stock after the last round of the spot assay, use 0.22 µm syringe filter to remove leftover bacteria from the viral stock. Save filtered viral stock in a new tube and store at 4 °C .
Calculate the titer (PFU/mL) of the filtered viral stock by spotting serial dilutions (up to 10-9 or more) on its host lawn.
Protocol references
Varona, N., Silveira, C. Seawater virome concentration with Vivaflow. protocols.io. 2023. https://dx.doi.org/10.17504/protocols.io.ewov1qdopgr2/v1
Reiter, M.A., Vorholt, J.A. Dashing Growth Curves: a web application for rapid and interactive analysis of microbial growth curves. BMC Bioinformatics 25, 67. 2024. https://doi.org/10.1186/s12859-024-05692-y
Meier, F., Williams, T., Paulsen, I. Welly: A Web-Tool for Visualizing Growth Curves from Microplate Data. Bioinformatics Advances 5(1), vbaf038. 2025. https://doi.org/10.1093/bioadv/vbaf038
Acknowledgements
We thank Bailey Wallace and Natascha Varona for providing bacterial strains for protocol development. We thank Ashley Zagame for sharing materials and stocks during protocol development.