Jul 21, 2025
Empirical assessment of soil resistance to surface crusting in winter cereals on loamy soils
- Lola Leveau1,
- Xavier Belin2,
- Grégoire ehaye2
- 1PEPA lab: Plant Ecology, ecoPhysiology and sustainable Agriculture, Earth & Life Institute, UCLouvain, Louvain-la-Neuve, Belgium;
- 2UCLouvain
- Lola Leveau: PhD student;
- Xavier Belin: Bioengineering master student
- Grégoire ehaye: Bioengineering master student
- Ecosystem Services indicators


Protocol Citation: Lola Leveau, Xavier Belin, Grégoire ehaye 2025. Empirical assessment of soil resistance to surface crusting in winter cereals on loamy soils. protocols.io https://dx.doi.org/10.17504/protocols.io.eq2ly43bplx9/v1
License: This is an open access protocol distributed under the terms of the Creative Commons Attribution License, which permits unrestricted use, distribution, and reproduction in any medium, provided the original author and source are credited
Protocol status: Working
We use this protocol and it's working
Created: July 18, 2025
Last Modified: July 21, 2025
Protocol Integer ID: 222771
Keywords: soil crust, soil surface, rainfall, aggregates, soil structural state, empirical assessment of soil resistance, surface crusting in winter cereal, soil resistance, loamy soil, loamy soils this protocol, structural state of the surface soil layer, surface soil layer, use in belgian winter cereal field, belgian winter cereal field, rate of crust formation, surface crusting, crust formation, impact of rainfall, winter cereal, hectare experimental plot, cumulative rainfall, sealed crust
Abstract
This protocol empirically measures the impact of rainfall on the structural state of the surface soil layer by determining the rate of crust formation relative to the initial aggregate size distribution and cumulative rainfall. It is designed for use in Belgian winter cereal fields on loamy soils, on one-hectare experimental plots, from sowing until the formation of a sealed crust. The method is adapted from Boiffin (1984).
Materials
General materials
- One wooden frame (internal dimensions: 35 × 50 cm), optionally equipped with fine white strings to divide the area into ten equal sections for facilitated photographic analysis.
- One hand tool suitable for mimicking seedbed preparation in no-till conditions such as direct seeding.
- One high-resolution smartphone or camera (capable of distinguishing 2 mm aggregates in a photo centered on the wooden frame).
- One measuring device (e.g., foldable meter) with millimeter precision to serve as a reference scale in photographs.
Per experimental plot
- 16 cross-stakes, 42 cm high.
- 4 labeled tags for the cross-stakes, indicating plot and subplot identifiers.
- 4 high-visibility flags (120 cm), if the farmer plans mechanical weeding during the observation period.
Before start
Experimental plot
This experiment is designed for a plot of one hectare within an arable field with winter cereal, with loamy soil and with a slope lower than 10%.
Experimental season
The experiment begins immediately after the sowing of the winter cereal, typically between mid-September and December in Belgium. It ends when the soil surface becomes completely sealed by a crust or when no aggregates smaller than 5 cm in diameter remain visible. This can occur within weeks or extend over several months, depending on the soil’s susceptibility to crusting and cumulative rainfall. In rare cases where complete sealing does not occur, observations may be stopped once no further crusting changes are observed despite additional rainfall events.
Subplot Installation and Maintenance
Before the first rainfall following cereal sowing, four subplots are established, each at the center of one quarter of the one-hectare experimental plot. In each subplot, four cross-stakes mark the corners of the observation area, defined by the external perimeter of the wooden frame. The longer side of the rectangle is aligned with the direction of crop rows.
Example of subplot installation, with the four cross-stakes placed at the external corners of the wooden frame. The wooden frame is removed after taking the photograph, while the cross stakes remain in the plot during the whole experiment. Photograph: Grégoire Dehaye.
The protocol requires the initial soil surface to be fragmented to enable observation of crust formation. In no-till conditions such as direct seeding, manual fragmentation is performed using a hand tool to simulate the tillage operations of a seedbed preparation.
To avoid interference with crust development, each subplot must remain free of vegetation and surface mulch throughout the experiment. Manual weeding and mulch removal are carried out at installation, and again after cereal seedling emergence.
To prevent disturbance from mechanical weeding, farmers are instructed to lift equipment when passing near subplots. In such cases, tall flags are placed beside each subplot to ensure their visibility and protection.
Data collection
A first photograph is taken immediately after subplot installation, to document the initial fragmented state of the soil before any rainfall. The photo is taken horizontally, capturing the entire study area along with the subplot label. A meter stick or another measuring tool is positioned next to the wooden frame to serve as a scale. If sunlight creates harsh shadows, the area is shaded to improve image quality. Photographs are named using the format “XX-A-YYYYMMDD”, where “XX” is the plot identifier, “A” the subplot identifier, and “YYYYMMDD” the date of image capture (year-month-day).
Subsequently, subplots are monitored weekly on average, with more frequent visits (every 2–4 days) following significant rainfall events, and less frequent visits (every 15 days or more) during extended dry periods. At each visit, a new photograph is taken following the same procedure.
The experiment concludes when the subplot soil is sealed by a crust over more than 90% of the area, or when only aggregates larger than 5 cm in diameter remain visible. At that point, a final photograph is taken and all markers (cross-stakes and flags) are removed. The endpoint may vary between subplots within a given plot.
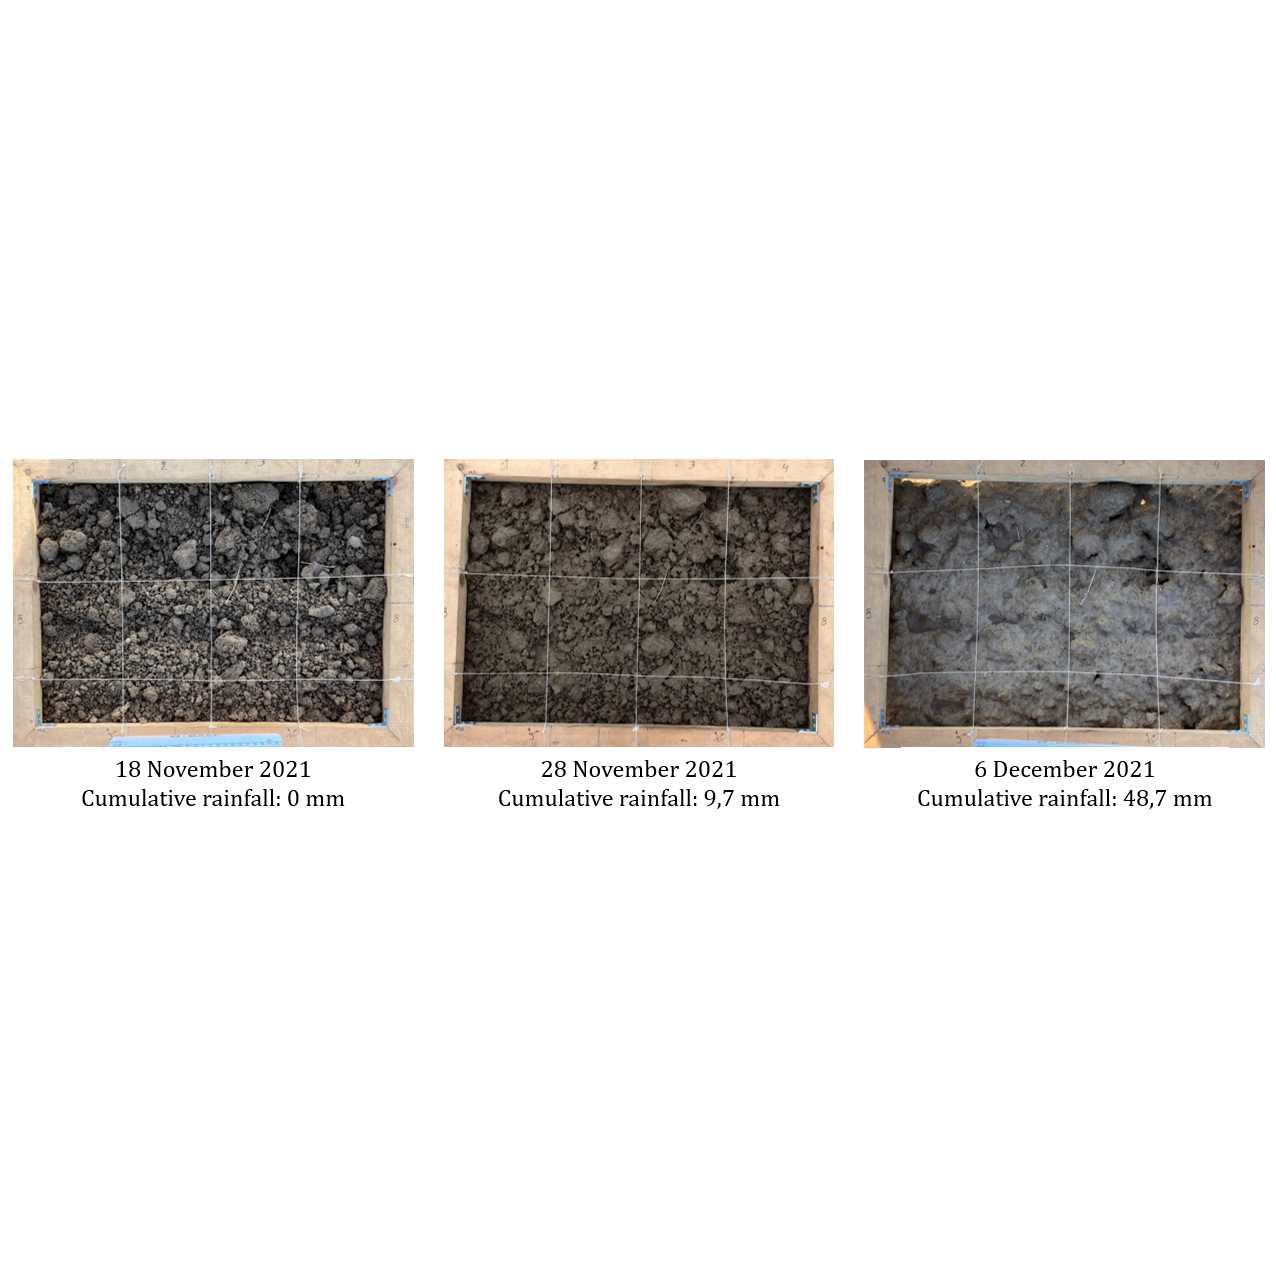
Example of soil surface layer evolution, from the sowing of the cereal in November until the coverage of more than 90% of the subplot area by a crust in December. Photograph: Grégoire Dehaye.
Throughout the experimental period, cumulative rainfall since cereal sowing is recorded for each plot and visit date. In Wallonia, daily rainfall data were obtained from the Pameseb weather station network, accessible via the Agromet platform of the Walloon Agricultural Research Centre (CRA-W, 2025). For each plot, data from the nearest weather station were used.
Variable calculation
For each subplot, the initial distribution of soil aggregate sizes is derived from the first photograph. The proportion of the subplot surface occupied by aggregates with maximum diameters of 2, 5, 10, 20, 30, 40, and 50 mm is visually estimated. This process may be facilitated using digital overlay tools and size-reference circles within image processing software. Unanalyzable areas (e.g. shadows, holes) are excluded from surface calculations.
Example of reference-size circles used on the software Gimp to determine the agregate size distribution on initial photographs. Author: Grégoire Dehaye.
For each subsequent photograph, the proportion of the subplot covered by a surface crust is visually estimated. Crust is defined as a continuous, homogeneous layer formed by the fusion of previously distinct soil aggregates under the effect of rainfall. To standardize and fasten assessment, we used a method where each of the ten equal-sized sectors of the subplot was assigned a crust coverage class: 0–5%, 6–25%, 26–50%, 51–75%, 76–95%, 96–99%, or 100%. The total crust coverage was then calculated as a weighted mean based on the midpoint of each class. However, any method determining the crust coverage is valid (the more precise, the better).
Visual help for determining the class of proportion of a sector (1/10 of subplot) covered by surface crust. Author: Lola Leveau.
Subsequent analyses will only include photographs up to the first visit where total crust coverage reaches or exceeds 90%.
For each photograph, the diameter of the largest aggregate already incorporated into the crust (D_lim) is inferred from the initial aggregate size distribution and the current crust covering. This estimation assumes that smaller aggregates integrate into the crust earlier (Boiffin, 2025). Hence, the aggregate sizes distribution curve gives the size of the bigger aggregate already incorporated, Dlim, which corresponds to the aggregate size associated with the current crust coverage percentage.
Process of determining the size of the largest aggregate already incorporated into the crust (D_lim). The blue curve is the initial cumulative distribution of soil aggregate sizes, estimated from the first photograph just after cereal sowing (blue-framed photograph). At the time of the red-framed photograph, 72% of the subplot area is covered by a crust. By inferring this surface in the initial cumulative distribution of soil aggregate sizes, and under the hypothesis that smaller aggregates disappear into the crust faster (Boiffin, 2025), we determine that the current D_lim is 17 mm. Photographs: Grégoire Dehaye. Figure: Lola Leveau.
Values of D_lim exceeding 50 mm are excluded from further analysis.
The rate of soil crust formation [mm aggregate size per mm rainfall] is calculated as the slope of a linear regression between D_lim (y-axis) and cumulative rainfall since the beginning of the experiment (x-axis). Using D_lim instead of crust surface coverage for this regression reduces bias from initial seedbed fineness, which can affect the surface coverage rate independently of the soil characteristics as small aggregates disappear faster into the crust.
Determination of the rate of soil crust formation. The black dots and the black plain curve represent the empirical evolution of crusting, while the red dashed line represent the linear regression line. NB: the red line illustrates the result of a linear regression, but was added manually and is not the result of a real linear regression (which we did without producing plots). Author: Lola Leveau.
Finally, the soil resistance to crusting during rainfall events [mm rainfall per mm aggregate size], calculated as the inverse of the soil crust formation rate. A higher value indicates greater resistance of the soil surface to rainfall-induced crusting.
Protocol references
Boiffin, J. (1984). La dégradation structurale des couches superficielles du sol sous l’action des pluies. La dégradation structurale des couches superficielles du sol sous l’action des pluies, Institut National Agronomique Paris Grignon (1984).
Acknowledgements
We would like to thank Jean Boiffin for the original protocol.
We also thank the master students who refined and applied this protocol for their master theses, and the 20 Belgian farmers who provided access to 60 crop fields to test this protocol between 2020 and 2023.