Mar 15, 2024
Version 5
ECIS Data Analysis for Stimulation of Human Pulmonary Microvascular Endothelial Cells (HPMECs) with Human Serum V.5
- Michael Bokoch1
- 1University of California, San Francisco
- UCSF Transplant Anesthesia Research Group (TARG)


Protocol Citation: Michael Bokoch 2024. ECIS Data Analysis for Stimulation of Human Pulmonary Microvascular Endothelial Cells (HPMECs) with Human Serum. protocols.io https://dx.doi.org/10.17504/protocols.io.bp2l69erklqe/v5Version created by Michael Bokoch
License: This is an open access protocol distributed under the terms of the Creative Commons Attribution License, which permits unrestricted use, distribution, and reproduction in any medium, provided the original author and source are credited
Protocol status: Working
We use this protocol and it's working
Created: March 15, 2024
Last Modified: March 15, 2024
Protocol Integer ID: 96723
Keywords: human pulmonary microvascular endothelial cell, human pulmonary microvascular, ucsf liver transplant biobank, endothelial cell, human serum sera from patient, confluency on ecis platform, human serum sera, ecis platform, hpmec
Funders Acknowledgements:
International Anesthesia Research Society
Grant ID: Mentored Research Award
Abstract
Sera from patients in our UCSF Liver Transplant Biobank are used to stimulate human pulmonary microvascular endothelial cells (HPMECs) grown to confluency on ECIS platform. This protocol prospectively defines the plan for data analysis from these experiments.
ECIS Data Analysis for HPMEC stimulation by Liver Biobank Sera
Determine Difference in Area-under-the-Curve (Normalized Resistance at 4000 Hz)
To be calculated after recording full ECIS curve after stimulation with human serum from liver transplant (LT) patients.
Goal: To calculate the difference in AUC between the normalized ECIS curves generated by (a) Liver transplant serum and (b) Healthy pooled serum.
Sign conventions:
- Baseline resistance is normalized to 1
- AUC of curve that drops below 1 = Negative AUC --> interpreted as an increase in EC permeability
- AUC of curve that rises above 1 = Positive AUC
e.g., for a typical Liver serum sample that induces permeability:
AUCLT serum = Negative number
AUCHealthy pooled serum = Positive number
ΔAUC = Negative number - Positive number = Large negative number
e.g., for a typical Liver serum sample that does not induce much permeability:
AUCLT serum = Smaller positive number
AUCHealthy pooled serum = Larger positive number
ΔAUC = Smaller positive number - Larger positive number = Small negative number
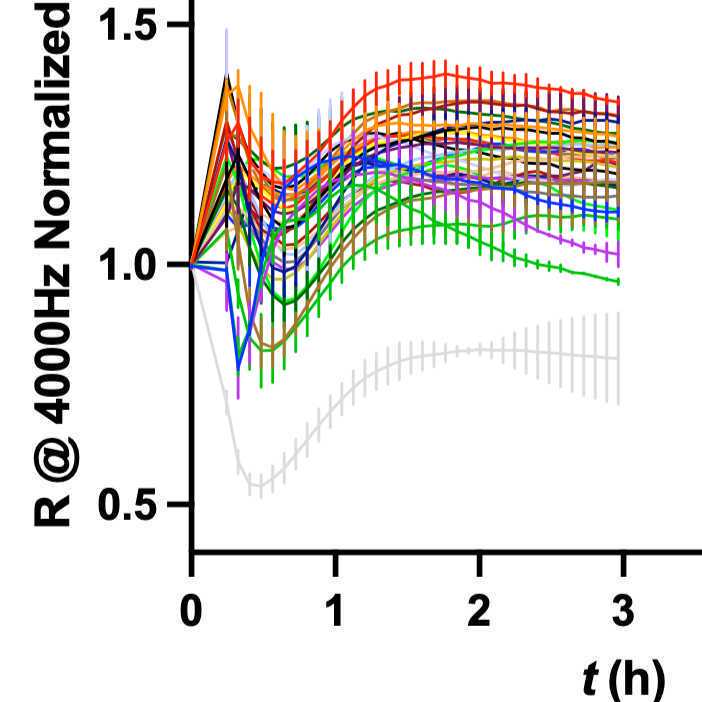
Final AUC analysis will use data from 0-3 hrs.
Prepare ECIS data for analysis
Using ECIS software, normalize the resistance. This is done by dividing the resistance at each time point by the baseline resistance (the plateau resistance reached just prior to stimulation with serum). This will set the baseline resistance = 1.
Export "Graph Data" and import into GraphPad prism.
Name data table "raw normalized_mm-dd-yy_cell line"
Align t=0
Duplicate X-Y tables with data from 0-6 hrs --> name duplicate "_adjustedt_0-3h"
Align time = 0
- Inspect normalized curves for a given experiment (day and cell line)
- Determine time point (tstim) where curves begin to diverge from baseline resistance = 1
- The time point prior to that time (tstim-1) will be set = 0 hrs
- Calculate time shift in Excel using the follwing formula:
tadjusted = toriginal - tstim-1
- Use tadjusted for determination of AUC 0-3 hrs.
Determine AUC from 0-3 hrs
Delete data points with tadjusted > 3 hrs
Analyze --> XY analyses --> Area under curve
- Baseline Y = 1
- Minimum Peak Height = ignore peaks < 5%
- Minimum Peak Width = leave blank
- Peak direction = "Also consider 'peaks' that go below the baseline."
From AUC Results --> Copy "Net Area" and "Std Error" to Excel.
Note: It is not necessary to copy/paste transpose each result individually. Copy the "Net Area" rows from the whole table and then use "=transpose()" function in Excel.
Calculate ΔAUC, error, and store data
Calculate ΔAUC
ΔAUC = AUCLT serum - AUCHealthy pooled serum
Notes:
- Steps 2 and 2.1 can be performed in a single Excel sheet after running the "transpose" function.
- Both AUC and ΔAUC can be tabulated in a single Prism worksheet (Grouped)
- Store results in a new "Grouped" table in Prism (Mean ± SEM) named "AUC" with column labels:
AUC, 0-3h
ΔAUCLT - Healthy, 0-3h
Standard error calculation for ΔAUC
Std ErrorΔAUC =
Where:
dx = Std ErrorAUC, LT serum
dy = Std ErrorAUC, Healthy pooled serum
Standard errors are obtained from the "Net Area" section of the Results tab in Prism after an AUC analysis.
Plot average curves with error bars from 0-6 h:
- Healthy serum with positive controls {LPS, TNF, IL-1b} and negative control {Media} - one for each day of experiment.
- Healthy serum with Liver serum {S1, S2, S3, S4, S5} - one for each patient.
- Generally there are 3 replicates, occasionally 2.
Upload mean ΔAUC0 to 3 h in REDCap for each patient, timepoint, and cell line.
Note: Standard errors are available in Prism (too cumbersome for REDCap, and generally quite small).
REDCap variables for Cell Line #1 are named:
auc_ln1_s1
auc_ln1_s2
...
auc_ln1_s5
... similarly for Cell Line #2:
auc_ln2_s1
auc_ln2_s2
...
auc_ln2_s5
Predefined comparisons for analysis
S1 vs. Healthy Serum - Q: Is liver serum at the start of surgery different from Healthy controls?
Perform one sample t-test (or one sample Wilcoxon signed rank test, if the normality assumption is not met) for each ΔAUC0 to 3 h time point vs. 0.0 (the value for Healthy Pooled Serum).
S1 vs. S3 - Q: What is the effect of liver reperfusion?
Perform paired t-test (or Wilcoxon signed rank test, if the normality assumption is not met) for ΔAUC0 to 3 h at the S1 vs. S3 time points, which were measured for each subject.
Perform additional pairwise comparisons for time points with missing data, as Supplementary Analysis:
Note: Control Column should be S1, Start of Surgery for all
- S1 vs. S2 - Q: What is the effect of surgery (dissection phase) alone with no liver reperfusion?
- S1 vs. {S4 or S5} - Q: If there is an effect of liver reperfusion, does it get worse with more time from reperfusion?
- S1 = Start of Surgery
- S2 = End of Dissection (before liver removal)
- S3 = 15 min after Portal Vein reperfusion
- S4 = 60 min after Portal Vein reperfusion
- S5 = 120 min after Portal Vein reperfusion (or End of Surgery, whichever comes first)
Supplementary details for each experiment
- Cell line #
- Passage #
- Old plate (yes/no)
- Seeding density (cells/well) - should be 40,000
- Plateau capacitance at 64,000 Hz, average and st. dev - prior to stimulation
- Plateau resistance at 4,000 Hz, average and st. dev - prior to stimulation
- Time of stimulation - elapsed from seeding ECIS plate