Sep 10, 2024
Cell Invasion in Direct Co-Culture
- Bianca Cruz Pachane1,
- Heloisa Sobreiro Selistre de Araujo1
- 1Department of Physiological Sciences, Universidade Federal de São Carlos - UFSCar


External link: https://doi.org/10.1002/jex2.70075
Protocol Citation: Bianca Cruz Pachane, Heloisa Sobreiro Selistre de Araujo 2024. Cell Invasion in Direct Co-Culture. protocols.io https://dx.doi.org/10.17504/protocols.io.e6nvw1799lmk/v1
Manuscript citation:
Pachane BC, Bottaro PHT, Machado AM, Castro CAd, Guerra G, Gozzer LT, Grigoli MM, Zutião AD, Fuzer AM, Cominetti MR, Altei WF, Selistre‐de‐Araujo HS (2025) Tumoural Hypoxic Extracellular Vesicles Foster a Protective Microenvironment in Triple‐Negative Breast Cancer. Journal of Extracellular Biology 4(9). doi: 10.1002/jex2.70075
License: This is an open access protocol distributed under the terms of the Creative Commons Attribution License, which permits unrestricted use, distribution, and reproduction in any medium, provided the original author and source are credited
Protocol status: Working
We use this protocol and it's working
Created: September 09, 2024
Last Modified: September 10, 2024
Protocol Integer ID: 107186
Keywords: Direct co-culture, Invasion assay, gelatinase assay, fluorescent gelatin degradation assay, cellular models for the tumor microenvironment, gelatinase activity, detecting gelatinase activity, tumor microenvironment, cell invasion, tumor cell, tnbc cell line mda, endothelial cell, cell, effect of hypoxic, epifluorescence microscopy analysis, cellular model, effect of hypoxic ev, culture assay, epifluorescence
Funders Acknowledgements:
São Paulo Research Foundation
Grant ID: 2021/01983-4
Abstract
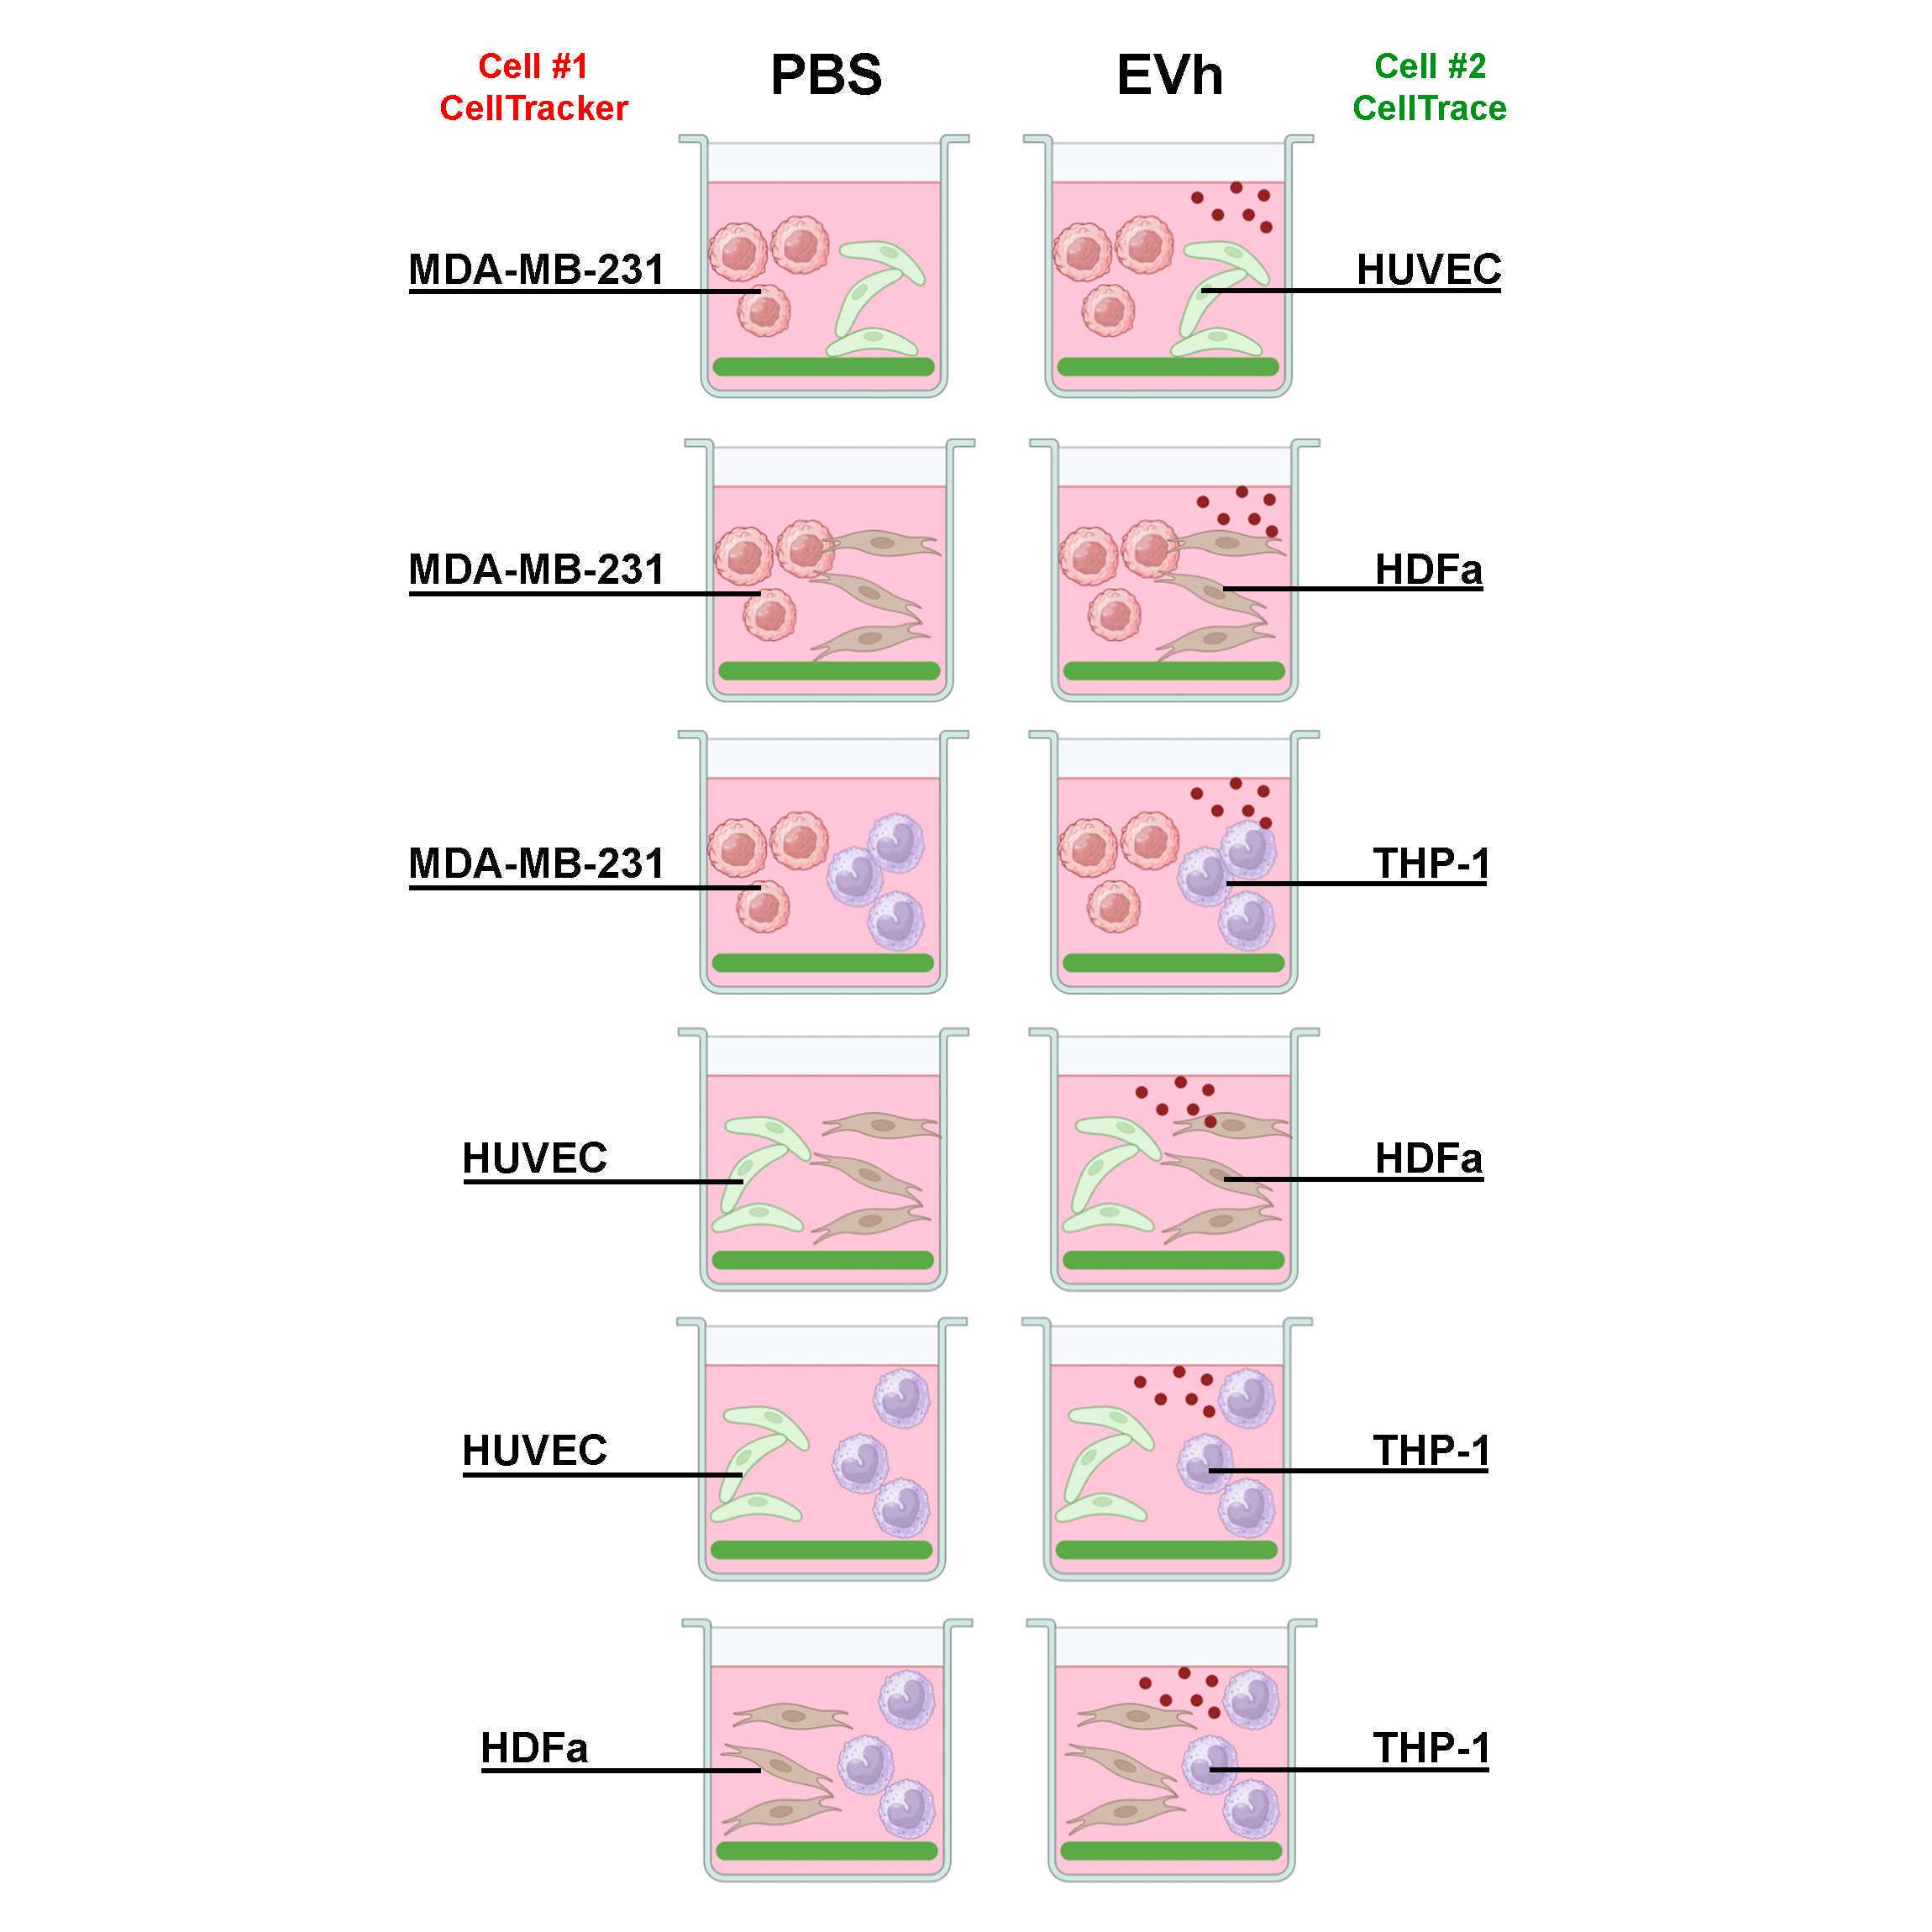
The fluorescent gelatin degradation assay is a method to study cell invasion by detecting gelatinase activity in vitro upon epifluorescence microscopy analysis. In this protocol, the method has been applied to evaluate the effect of hypoxic EVs from TNBC cell line MDA-MB-231 in a direct co-culture assay, using four cellular models for the tumor microenvironment. Hence, MDA-MB-231 (tumor cell), HUVEC (endothelial cell), HDFa (dermal fibroblast), and THP-1 (monocyte) have been seeded in six distinct combinations. Adapted from Pachane et al (2022) (PMID: 36293503).
Image Attribution
Experimental diagram created using BioRender.com and Adobe Photoshop.
Materials
Materials and reagents
- Corning 96-well Flat Clear Bottom Black Polystyrene TC-treated Microplates, Individually Wrapped
- Sterile microtubes and pipettes
- Gelatin From Pig Skin, Fluorescein Conjugate, Thermo Fisher - Catalog #G13187
- Sterile PBS
- OptiMEM I Reduced Serum Media, Gibco - Catalog #31985070
- Trypan Blue solution 0.4%, Merck Millipore (Sigma-Aldrich) - Catalog #T8154-100 ml
- Paraformaldehyde solution (PFA 4% in deionized water, pH 7.6 - Sterile)
- Triton X-100 0.1% (v/v) in deionized water
- CellTracker™ Red CMTPX, Invitrogen - Catalog #C34552
- CellTrace™ CSFE, Invitrogen - Catalog #C34554
- Phalloidin + DAPI (1 µl Phalloidin-iFluor 647, Abcam - Catalog #ab176759 + 0.76 µL 4,6-Diamidino-2-Phenylindole, Dihydrochloride (DAPI), Thermo Fisher Scientific - Catalog #D1306 in 5 mL PBS)
Cell lines and growth media
- MDA-MB-231 (ATCC‱ CRM-HTB-26‱) - Leibovitz L-15 10% FBS
- HDFa (ATCC‱ PCS-201-012‱) - DMEM 10% FBS 1% pen/strep
- HUVEC (ATCC‱ CRL-1730‱) - DMEM 10% FBS 1% pen/strep
- THP-1 (ATCC‱ TIB-202‱) - RPMI 1640 10% FBS 1% pen/strep
Equipments:
- Biological cabinet
- Cell incubator (37 ºC, 5% CO2)
- Cell counter - TC20 Cell Counter, Bio-Rad - Catalog #1450011
- Epifluorescence microscope - ImageXpress Micro XLS, Molecular Devices - Catalog #500496
Protocol materials
Parafilm
Troubleshooting
Safety warnings
Light-sensitive assay. Work under sterile conditions.
Before start
Fluorescent gelatin preparation: Under sterile conditions, solubilize the fluorescent gelatin stock at 37 °C with warmed PBS following the manufacturer's instructions for a concentration of 5 mg/mL . Aliquot in microtubes and maintain at -20 °C until time of use.
Before use, thaw gelatin at 37 °C for 00:30:00 . Dilute stock to a 0.2 mg/mL working solution with warmed PBS and maintain at 37 °C until use.
Cell culture: Maintain cells in culture during at least two passages after thawing.
Experimental Design and Plate Coating
Open a new 96-well black plate under sterile conditions and label groups in technical triplicates to contain a vehicle (PBS) control (i.e., untreated cells in OptiMEM) and the EVh-treated group (i.e., EVh-treated cells in OptiMEM) for each co-culture combination:
- MDA-MB-231 + HUVEC
- MDA-MB-231 + HDFa
- MDA-MB-231 + THP-1
- HUVEC + HDFa
- HUVEC + THP-1
- HDFa + THP-1
| 1 | 2 | 3 | 4 | 5 | |
| A | MDA-HUVEC PBS | MDA-HUVEC PBS | MDA-HUVEC PBS | MDA-HUVEC EVh | MDA-HUVEC EVh |
| B | MDA-HDFa PBS | MDA-HDFa PBS | MDA-HDFa. PBS | MDA-HDFa EVh | MDA-HDFa EVh |
| C | MDA-THP1 PBS | MDA-THP1 PBS | MDA-THP1 PBS | MDA-THP1 EVh | MDA-THP1 EVh |
| D | HUVEC-HDFa PBS | HUVEC-HDFa PBS | HUVEC-HDFa PBS | HUVEC-HDFa EVh | HUVEC-HDFa EVh |
| E | HUVEC-THP1 PBS | HUVEC-THP1 PBS | HUVEC-THP1 PBS | HUVEC-THP1 EVh | HUVEC-THP1 EVh |
| F | HDFa-THP1 PBS | HDFa-THP1 PBS | HDFa-THP1 PBS | HDFa-THP1 EVh | HDFa-THP1 EVh |
| G | |||||
| H |
| 6 | 7 | 8 | 9 | 10 | |
| A | MDA-HUVEC EVh | ||||
| B | MDA-HDFa EVh | ||||
| C | MDA-THP1 EVh | ||||
| D | HUVEC-HDFa EVh | ||||
| E | HUVEC-THP1 EVh | ||||
| F | HDFa-THP1 EVh | ||||
| G | |||||
| H |
| 11 | 12 | |
| A | ||
| B | ||
| C | ||
| D | ||
| E | ||
| F | ||
| G | ||
| H |
Apply 70 µL of the fluorescent gelatin working solution at 0.2 mg/mL directly to the bottom of each well.
Avoid the formation of bubbles.
Incubate plate for 00:30:00 at 37 °C 5% CO2.
30m
Carefully remove excess coating by aspiration.
Avoid touching well bottom.
Pre-condition coating with 200 µL OptiMEM for 00:30:00 at 37 °C 5% CO2.
30m
Cell Staining and Seeding
30m
Subculture cells as usual. Resuspend cell pellets in OptiMEM and count cells using the trypan blue exclusion method.
Stain cells using CellTrace™ CSFE or CellTracker™ CMPTX
Separate each cell line in two 15-ml conical tubes, each containing 1x10⁶ cells in 1 mL OptiMEM.
Add 1 µL of CellTrace™ CSFE or 0.5 µL of CellTracker™ CMPTX to cell suspensions, to achieve a 5 µM final concentration. Pipette well to mix.
Incubate cell suspensions at 37 °C 5% CO2 for 00:30:00 , protected from light.
30m
Dilute cell suspensions with 4 mL OptiMEM and centrifuge at 1200 rpm, 00:05:00
5m
Resuspend cell pellets in 1 mL OptiMEM and recount cells using the trypan blue exclusion method.
Remove the pre-conditioning media from the plate.
Add cell suspensions to wells following the table below:
| A | B | C | |
| Group | Cell #1 (CellTracker) | Cell #2 (CellTrace) | |
| MDA-HUVEC | MDA-MB-231 (5000 cells/well) | HUVEC (5000 cells/well) | |
| MDA-HDFa | MDA-MB-231 (5000 cells/well) | HDFa (2000 cells/well) | |
| MDA-THP1 | MDA-MB-231 (5000 cells/well) | THP-1 (2000 cells/well) | |
| HUVEC-HDFa | HUVEC (5000 cells/well) | HDFa (2000 cells/well) | |
| HUVEC-THP1 | HUVEC (5000 cells/well) | THP-1 (2000 cells/well) | |
| HDFa-THP1 | HDFa (2000 cells/well) | THP-1 (2000 cells/well) |
Note that the total well volume should not surpass 200 µl!
Treat cells with EVh (109 particles/ml) or the equivalent treatment volume in PBS.
Incubate plate for24:00:00 at 37 °C 5% CO2.
1d
Fixation and Cell Staining
10m
Remove the supernatant by aspiration.
Fix cells with 100 µL warmed 4% PFA at Room temperature for 00:10:00
10m
Wash cells twice with 100 µL PBS.
Permeabilize cells with 100 µL 0.1% Triton X-100 at Room temperature for 00:05:00
5m
Wash cells twice with 100 µL PBS.
Stain cells with the DAPI + Phalloidin-647 mixture. Add 100 µL of staining solution to each well and incubate at Room temperature , protected from light for 00:20:00
20m
Wash cells twice with 100 µL PBS.
Maintain wells with200 µL PBS for analysis. Seal the plate with Parafilm and cover it with aluminum foil for storage at 4 °C for up to 6 months.
Cell Imaging by Epifluorescence HTS
Using the microscope ImageXpress Micro XLS+ (Molecular Devices), check the template for the Corning 3603 plate and the filters for DAPI (nuclei), FITC (gelatin), TxRed (CMPTX) and Cy5 (phalloidin-647).
Set laser intensity to a minimum of 10 ms and increase gradatively if necessary.
Check the wells using the 4X objective.
Change into the 20x objective and adjust the laser focus. Select 9 sites per well minimally.
Acquire the plate. Export metadata for analysis.
For representative images, change to the 40x objective and adjust the laser focus.
Select the sites of interest and acquire.
Export image channels and combinations.
Gelatin Degradation Quantification on FIJI
On FIJI (ImageJ), import HTD files through BioFormats.
Images should already be scaled. If not, adjust scale based on the objective lens used for acquisition.
Set measurements to contain "Area", "Standard Deviation", "Shape Descriptor", "Mean grey value", "Perimeter" and "Display label".
Concatenate all stacks into a single hyperstack.
Split channels and select the FITC stack for analysis.
Set a threshold to encompass the degradation spots but not the background. Write down the threshold values. Create a new stack with the binary images.
To measure the degraded area, analyze particles with a range of "5-Infinity" and select "Summarize".
Save CSV file. The degraded area (in µm2) per site will be compared between groups in the statistical analysis.
Cell Counting on FIJI
and continue until Step #30.
Split channels and select the DAPI stack for counting.
Set a threshold to contain nuclei. Create a new stack with the binary images.
To count cells, analyze particles with a range of "10-infinity" and select "Summarize".
Save CSV file.
Cell Morphology Analysis on FIJI
and continue until Step #30.
Split channels and select the Cy5 stack for analysis.
Duplicate the stack as a guide.
Merge the Cy5 stack with the TxRed stack to visually differentiate cell types.
Set a threshold to encompass cell cytoplasm. Create a new stack with the binary images.
Using the duplicated stack as a guide, section cells using the "pencil" tool with a 3 px thickness.
To analyze cell morphology, analyze particles with a range of "10-Infinity" and check "Clear Results".
Save CSV file. The cell circularity index of each cell will be compared between groups in the statistical analysis.
Image Processing for Representative Cells
and continue until Step #30.
Split the channels of the stacks of interest.
Adjust channel colors using the "Lookup Tables" menu.
Select the cell of interest in a 200x200 px squared selection.
Save selections in each channel and the combination of all channels in PNG images.
Protocol references
PACHANE, Bianca Cruz et al. Small Extracellular Vesicles from Hypoxic Triple-Negative Breast Cancer Cells Induce Oxygen-Dependent Cell Invasion. International Journal of Molecular Sciences, [s. l.], v. 23, n. 20, p. 12646, 2022.
EVEN-RAM, Sharona; ARTYM, Vira. Extracellular Matrix Protocols: Second Edition. [S. l.]: Humana Press, 2009.