Oct 01, 2025
Version 2
A Psycholinguistics Protocol with Simultaneous Multimodal Physiological Data Collection for Individualized Pre-Screening Depressive Disorders V.2
- Reza Sameni1,2,
- Gabriela I. Cestero2,
- Masoud Nateghi1,
- Victoria P. Sharpe3,
- Chuoqi Chen2,
- Yi Yang1,
- Apoorva Vallampati3,
- Lina Chitadze1,
- Arim Choi3,
- Zeineb Bouzid2,
- Deepanshi 1,
- Juhee Vyas1,
- Lucy Shallenberger1,
- Calista Murray1,
- Jaiyoun Choi1,
- Ian Vollmer1,
- Sajjad Karimi1,
- Cem O. Yaldiz2,
- Rachel Bull1,
- Aaron Winder4,
- Bradly T. Stone4,
- Gina R. Kuperberg3,
- Spencer Lynn4,
- Bethany K. Bracken4,
- J. Douglas Bremner1,
- Omer T. Inan2
- 1Emory University;
- 2Georgia Institute of Technology;
- 3Tufts University;
- 4Charles River Analytics



Protocol Citation: Reza Sameni, Gabriela I. Cestero, Masoud Nateghi, Victoria P. Sharpe, Chuoqi Chen, Yi Yang, Apoorva Vallampati, Lina Chitadze, Arim Choi, Zeineb Bouzid, Deepanshi , Juhee Vyas, Lucy Shallenberger, Calista Murray, Jaiyoun Choi, Ian Vollmer, Sajjad Karimi, Cem O. Yaldiz, Rachel Bull, Aaron Winder, Bradly T. Stone, Gina R. Kuperberg, Spencer Lynn, Bethany K. Bracken, J. Douglas Bremner, Omer T. Inan 2025. A Psycholinguistics Protocol with Simultaneous Multimodal Physiological Data Collection for Individualized Pre-Screening Depressive Disorders. protocols.io https://dx.doi.org/10.17504/protocols.io.dm6gpme3dgzp/v2Version created by Reza Sameni
License: This is an open access protocol distributed under the terms of the Creative Commons Attribution License, which permits unrestricted use, distribution, and reproduction in any medium, provided the original author and source are credited
Protocol status: Working
We use this protocol and it's working
Created: October 01, 2025
Last Modified: October 01, 2025
Protocol Integer ID: 228772
Keywords: Psycholinguistics, Depression screening, Electroencephalogram, Electrocardiogram, Photoplethysmography, Electrodermal Activity, Noninvasive Blood Pressure, Seismocardiogram, Respirometry, Eye Tracking, Major Depressive Disorder, PHQ-9, BDI-II, MINI, Multimodal Monitoring, simultaneous multimodal physiological data collection, monitoring of depressive disorder, recordings from electroencephalography, psycholinguistics protocol, depressive symptom severity, screening depressive disorder, electroencephalography, physiological systems through hardware, depressive disorder, referential linguistic stimuli, major depressive disorder, depression, using psychopy, emotional processing, autonomic response, multimodal data collection framework, implicit mental health condition, physiological system, peripheral nervous system activity in response, synchronized recording, eye tracking, stimuli, individualized belief evaluation, fatigue, rich multimodal dataset from individual, electrodermal activity, symptoms of depression, s
Funders Acknowledgements:
Defense Advanced Research Projects Agency (DARPA) and Naval Information Warfare Center Pacific (NIWC Pacific)
Grant ID: N6600123C4002
Disclaimer
This material is based upon work supported by the Defense Advanced Research Projects Agency (DARPA) and Naval Information Warfare Center Pacific (NIWC Pacific) under Contract N6600123C4002. Any opinions, findings and conclusions, or recommendations expressed in this material are those of the author(s) and do not necessarily reflect the views of DARPA or NIWC Pacific.
Abstract
We present the PRESCRIBE (Preconscious Signal Compilation for Robust and Individualized Belief Evaluation) protocol, a structured, multimodal data collection framework designed to investigate neurophysiological and autonomic responses associated with mild and major depressive disorders. The protocol integrates self-referential and non-self-referential linguistic stimuli with synchronized recordings from electroencephalography, electrocardiography, photoplethysmography, seismocardiography, electrodermal activity, respiration, continuous noninvasive blood pressure, and eye tracking. Participants are prescreened using standardized instruments (BDI-II, PHQ-9, and MINI) or through self-reports, and complete a 2.5 to 3-hour laboratory task that probes implicit mental health conditions through 3–4-sentence vignettes that concluded with an emotionally-salient critical word designed to align with symptoms of depression (e.g., anhedonia, fatigue). Stimuli are presented using PsychoPy and synchronized with all physiological systems through hardware and software triggers. The protocol captures high-temporal-resolution data reflecting both central and peripheral nervous system activity in response to the critical word, enabling the identification of objective markers associated with depressive symptom severity. PRESCRIBE has been implemented across three research sites, generating a rich multimodal dataset from individuals with and without depression. This protocol supports mechanistic studies of cognitive-emotional processing and facilitates the development of scalable, non-invasive tools for early detection and monitoring of depressive disorders, including wearable-sensor applications in clinical and real-world environments.
Guidelines
General Guidelines
Personnel Training: Research personnel must be trained in the application of multimodal physiological sensors, EEG setup, stimulus presentation (via PsychoPy), and participant-facing procedures. Team members must complete certified training in ethical human subjects research (e.g., CITI or institutional equivalent). At least one supervising member with domain expertise in biosignal acquisition, EEG, or psychiatry must be on site during sessions.
Protocol Adherence: The protocol must be implemented as documented in the approved Standard Operating Procedure (SOP), including sensor order (thoracic, head cap/electrodes, followed by arm and hand sensors), event code synchronization, and session structure. Modifications require prior IRB approval.
Ethical Compliance: Use only IRB-approved consent forms, assessments, and questionnaires. Verify approval numbers before participant recruitment. Confirm all study team members are listed in the IRB protocol.
Pre-session Equipment Check: Prior to each session, perform a full verification of all systems and sensors. Test synchronization between stimulus presentation and physiological data acquisition using diagnostic ‘ecode’ scripts.
Environmental Setup: The recording environment should be electromagnetically shielded or otherwise optimized to reduce ambient noise and interference. Unnecessary electronic equipment must be powered down or removed.
Real-time Monitoring: Physiological signals (EEG, ECG, PPG, EDA, SCG, respiration, CNAP, and eye tracking) must be monitored in real time throughout each session. Specifically, EEG and ECG are indispensable to the protocol. Operators should pause recording to troubleshoot if either signal is lost or significantly corrupted.
Data Handling and Backup: After data collection, de-identified participant data should be securely backed up to local/cloud storage. All data must be encrypted and stored using access-controlled systems. Backup logs must be maintained, and checksum verification should be performed upon data transfer to ensure data integrity.
File Management: Use standardized file naming conventions and folder structures to ensure traceability across participants, modalities, and sites, and ease of software development. Include subject IDs and modality with appropriate extensions in filenames.
Sensor-Specific Guidelines
EEG: Use a 32-channel BioSemi ActiveTwo system. Confirm proper electrode placement and low electrode offsets (±50 mV or less). Accessory electrodes (EOG and mastoids) must be applied using appropriate skin prep. CMS and DRL electrodes must be connected prior to system activation and checked throughout data collection.
ECG: Apply a standard 3-lead configuration using wireless Biopac BioNomadix modules. Prepare skin with alcohol and NuPrep abrasion to ensure low impedance.
PPG: Place finger clip sensor (left ring finger). Avoid keypad clicking with the same hand.
EDA: Attach palm electrodes (left hand) with isotonic gel. Allow 5-minute signal stabilization before beginning the task.
SCG: Secure the triaxial accelerometer to the sternum using clinical-grade tape. Ensure correct axis orientation and firm placement to reduce motion artifacts.
Respiration: Fasten thoracic respiration belt snugly, allowing full range of motion. Confirm signal responsiveness during deep breaths.
Blood Pressure (CNAP Monitor 500): Connect finger-cuffs to left hand and arm cuff to right arm. Alternate finger-cuff between index and middle fingers during recalibration breaks. Perform CNAP calibration process before block 1 and after block 4.
Eye Tracking: Use EyeLink 1000 Plus system. Perform a 9-point calibration at the start of each block. Monitor calibration drift and recalibrate as needed.
Event Codes (Ecodes): Confirm that PsychoPy transmits all synchronization triggers (ecode triplets) to BioSemi, Biopac, and EyeLink systems. Verify using diagnostic scripts and real-time trigger log inspection before beginning experimental blocks.
Materials
Table 5: List of equipment used in the PRESCRIBE data collection protocol
| A | B | C | |
| Modality/Unit | Sensor/Modules | Specs/Notes | |
| Biopac Central Module and Interfaces | Biopac MP160 data acquisition & analysis system; Biopac HLT100C interface module; Biopac STP100D-C Isolated Digital Interface | The ECG, SCG, PPG, blood pressure, respiration and EDA are routed through the HLT100C, connected to the MP160. The STP100D-C receives trigger signals (also sent to EEG and eye tracking systems) via parallel port from the stimulus presentation computer. Sampling rate for all Biopac-collected signals is 2kHz (custom-set) Note: the HLT100C is recommended over the former UIM100C model to protect subjects from possible power surge traveling through the BP system, to the interface and EDA modules, and out through the EDA electrodes. | |
| Electrocardiogram (ECG) | Biopac BioNomadix BN-RSPEC wireless transmitter & receiver; Biopac BN-EL30-LEAD3 electrode leads; 3M Red Dot ECG monitoring electrodes | 3 electrodes on chest/abdomen; Input voltage range: up to ±2mV; Gain: 2000; Output range: ±10V; Bandlimits: 0.05Hz to 150Hz; Noise voltage: 0.9μV RMS; CMRR: 110dB typical at 50/60Hz, 90dB minimum; CMII: 1000MΩ (50/60Hz); Differential input impedance: 2MΩ | |
| Electrodermal activity (EDA) | Biopac EDA100C transducer module; Biopac LEAD110A electrode leads; Biopac EL507A EDA electrodes; Biopac GEL101A isotonic electrode gel | 3 electrodes on palm/wrist; filtering options (switches on module); Gain: 20μS/V; Low pass filter: 10 Hz; High pass filter (2 switches): DC, DC. Input conductance range: 0-200μS/V DC, ±200μS/V @ 0.05Hz (with set gain); Minimum resistance: 5kΩ (with set gain); Output range: 0-10V nominal, ±10V full (analog); Sensitivity: 0.7nS (with MP System); Excitation voltage: 0.5VDC (constant voltage) | |
| Non-invasive continuous blood pressure (NICBP) | Biopac DA100C amplifier module; CNAP Monitor 500 (sold as NIPB100D through Biopac) | Double inflatable finger cuff sensor for continuous BP; Upper arm inflatable cuff for automated scaling to brachial pressure; 100Hz sample rate; DA 100C switch selectable filter: Gain=1000; 10 Hz Low pass filter: Off; Low pass filter: 300 Hz; High pass filter: DC | |
| Photoplethysmogram (PPG) | Biopac PPG100C amplifier module; TCIPPG3 transducer connector interface; Berry reusable SpO2 sensor | Infrared transmission PPG finger clip sensor; TCIPPG3 bandwidth: 0.05Hz to 160Hz; PPG100C filtering selections (switches on module); Gain: 10; Low pass filter: 10 Hz; High pass filter (2 switches): DC (selected at Emory), 0.05Hz (selected at Georgia Tech); PPG100C input signal range: ±2000mV (with set gain); Output range: ±10 V (analog); Noise voltage: 0.5μV rms (amplifier contribution); Excitation: 6 V | |
| Respiration | Biopac BioNomadix BN-RSPEC wireless transmitter & receiver; Biopac BN-RESP-XDCR respiration transducer; Biopac BioNomadix BN-STRAP-137 strap | Adjustable elastic strap with attached transducer; Bandlimits: DC to 10Hz; Resolution: 4.88mV; Output range: ±10V | |
| Seismocardiogram (SCG) | PCB Piezotronics 482C15 4-channel signal conditioner; PCB Piezotronics 356A32 triaxial accelerometer | Accelerometer taped on sternum; Accelerometer sensitivity (±10%): 100mV/g; Measurement range: ±50g pk; Accelerometer frequency range (±5%): 1.0 to 4000Hz; Broadband resolution: 0.0003g rms; Nonlinearity: ≤1%; Transverse sensitivity: ≤5%; Output range: ±10V | |
| Electroencephalogram (EEG) | BioSemi ActiveTwo system; Custom 32 wet electrode head caps | User-selectable sample-rate: 2, 4, 8, 16kHz/channel. Set to 2kHz in PRESCRIBE; Input range: ±524mV; Resolution: 31nV | |
| Eye tracking (and pupillometry) | SR Research EyeLink 1000 Plus; SR Research RP-HDR-CUPTC cup-style chinrest (with forehead rest removed at Georgia Tech) | Head supported experimental design with camera in front of subject; Sampling rate: 2kHz; 35mm lens; Accuracy: down to 0.15° (0.25-0.50° typical); Resolution: 0.01° rms, 0.05° microsaccade resolution; Trackable range: 32° x 25° | |
| PsychoPy-running machine | Machine used for running the PsychoPy software and displaying vignettes | Dell OptiPlex 7010 Plus Tower: CPU: 13th Gen Intel Core i7-13700; OS: Windows 11 Pro; RAM: 16GB; Hard drive: 512GB; Video Card: NVIDIA GeForce RTX 3050; Dell 27 Gaming Monitor – G2723HN, Diagonal size: 27”, Max resolution: 1920x1080 pixels, Refresh rate: up to 165Hz (set to 120Hz) SR Research button box (can use other button devices, this one was just included in our EyeLink 1000 purchase) | |
| Eye-tracking machine | Machine connected to the eye tracker and running SR Research EyeLink 1000 Plus | Computer tower (EyeLink software pre-installed) and monitor included with purchase of EyeLink 1000 Plus: Dell OptiPlex 7050 Mini Tower; CPU: Intel Core i5; Acer V176L 17" LED LCD Monitor; Diagonal size: 17”; Max resolution: 1280x1024 pixels; Refresh rate: 75Hz | |
| Biopac and BioSemi data collection machine | Machine connected to Biopac and BioSemi and running AcqKnowledge and ActiView software | Dell OptiPlex 7010 Plus Tower; CPU: 13th Gen Intel Core i7-13700; OS: Windows 11 Pro; RAM: 16GB; Hard drive: 512GB; Video Card: NVIDIA GeForce RTX 3050; Dell 27 Gaming Monitor – G2723HN; Diagonal size: 27”; Max resolution: 1920x1080 pixels; Refresh rate: up to 165Hz |
Table 6: List of inventories and disposables used in the PRESCRIBE data collection protocol
| ITEM | DESCRIPTION | SENSOR | UNIT | QTY | |
| DA-AT-BCBS | ActiveTwo Base System | EEG | 1 | ||
| DA-AT-BCAC | ActiveTwo 8 Channel Amplifier/Converter Module | EEG | 5 | ||
| DA-AT-MSF10SC | ActiveTwo Fiber Optic Cable | EEG | 1 | ||
| DA-AT-ESP32ABC-A | ActiveTwo 32 x PIN-type active sensor | EEG | 1+1 spare | ||
| DA-AT-ESCDP | ActiveTwo Pin-Type CMS & DRL Electrodes On DIN Connector | EEG | 1 | ||
| DA-AT-EXTOF1 | ActiveTwo Flat-Type Active Electrode - Individual Lead/Touchproof Connector | EEG | 4/5 | ||
| DA-AT-EXTOP1 | ActiveTwo Pin-Type Active Electrode - Individual Lead/Touchproof Connector | EEG | 2 | ||
| DA-AT-HCM32ABC | ActiveTwo Head Cap Medium (Red) 32 Electrode Holders, 1020 ABC | EEG | 1 | ||
| DA-AT-HCML32ABC | ActiveTwo Head Cap Medium/Large (Red/Blue) 32 Electrode Holders, 1020 ABC | EEG | 1 | ||
| DA-AT-HCL32ABC | ActiveTwo Head Cap Large (Blue) 32 Electrode Holders, 1020 ABC | EEG | 1 | ||
| SD-MS-TCATTPSM | ActiveTwo Trigger Port Splitter / Merger | ||||
| SD-MS-TCPA | ActiveTwo Parallel Trigger Cable for Presentation / E-Prime | EEG/Data acquisition | 1 | ||
| CS-MS-MSBCB | 17 cm x 5 mm Bendable Stainless Steel and Nylon Brush | EEG (cleaning) | 1 | ||
| CS-GP-EGSG12 | SignaGel 250 g (8.8 oz.) tube, box of 12 tubes | EEG | 1 | ||
| CS-SY-SYMJ12 | MonoJect 12 cc Syringe with Curved Plastic Tip - Non-Sterile - box of 50 | EEG | 2 | ||
| CS-MS-MSCHPS32 | Hydrogen Peroxide Disinfectant Spray, 32 oz. | EEG (cleaning) | 1 | ||
| TU-CO-ORPCS | Plastic head-cap stand for drying and storage of electrode caps | EEG | 2 | ||
| CS-AT-ARIV4X19 | 100 ea adhesive electrode washers, 4 mm id x 19 mm od | EEG | 5 | ||
| CS-MS-MSDSD | Dawn Ultra Dishwashing Liquid, Original, 14 Fl Oz or larger | EEG (cleaning) | 1 | ||
| KEY12 | ACQ5 License Key+Add-ons-Blue | Data acquisition | Each | 3 | |
| CBLETH1 | Cable, ethernet, 2 meters, (#13404) | Data acquisition | Each | 1 | |
| AC150A-1 | Power Supply for MP150/160 | Data acquisition | Each | 1 | |
| ACCORD-US | AC Power Cord (U.S.A.) | Data acquisition | Each | 1 | |
| ETHUSB | USB Ethernet Adaptor | Data acquisition | Each | 1 | |
| INSTMP-DEV | Install AcqKnowledge Developer (packet) | Data acquisition | Each | 1 | |
| TOKEN-BAS | License token Basic/Workflow | Data acquisition | Each | 1 | |
| MP160 + STP100D | MP160 Data Acquisition w/ STP100D Isolated Digital Interface. Note: Georgia Tech used an older version of the STP100D, the HLT100C High Level Transducer Interface Module | Data acquisition | Each | 1 | |
| BN-EL45-LEAD3 | Electro Lead 3x45cm BioNomadix | ECG/RSP | Each | 1 | |
| BN-RESP-XDCR | Respiration Xdcr - BioNomadix | ECG/RSP | Each | 1 | |
| BN-RSPEC-R | BioNomadix RSP & ECG System (with transmitter, receiver, and velcro strap) | ECG/RSP | Each | 1 | |
| BN-BAT-CHRG | BioNomadix Battery Charger | ECG/RSP | Each | 1 | |
| NuPrep Skin Prep Gel | Gently exfoliate external EEG electrode sites on subject before EEG application | EEG | Pack (3 pk) | 1 | |
| Morton Popcorn Salt Shaker | Soak EEG electrodes in salt to optimize signal / check for defects | EEG | Each | 1 | |
| Cotton swabs with wooden handles | Twirl in EEG cap holes to part hair / gently exfoliate scalp (can also do this with syringes) | EEG | Pack (200 pcs) | 1 | |
| CBL110C | Ribbon Cable, DB25 female-male | System Synchronization | Each | 1 | |
| CBL122 | Unisolated RJ11 to 3.5mm Jack | SCG | Each | 3 | |
| BN-STRAP-137 | BioNomadix Strap - 137cm | PPG | Each | 1 | |
| RXSTRAP-RSP | Body Strap for RSP transducer | PPG | Each | 1 | |
| AMI100D + PPG100C | Amplifier Input Module w/ Photoplethysmogram Amplifier | PPG | Each | 1 | |
| TCIPPG3 | Interface Nonin 9-pin/PPG100C | PPG | Each | 2 | |
| Berry reusable SpO2 finger clip | Reusable PPG sensor (infrared transmission finger clip) | PPG | Each | 1 | |
| ELP-GL-CAM | EyeLink 1000 Plus Camera | Pupillometry | Each | 1 | |
| ELP-HPC-OPTIPLEX-XE4 | EyeLink Plus Standard Host PC - Dell OptiPlex XE4 Minitower containing: parallel port card, ethernet adapter and QNX license | Pupillometry | 1 | ||
| SR-LCD-17-V2 | 17-inch LCD Monitor - Acer V176 (bd) | Pupillometry | Each | 1 | |
| RP-CCR-TC-HS | Cup-style chinrest with table clamp mechanism and head support | Pupillometry | Each | 1 | |
| SR-RU-TM | Roll up tape measure | Pupillometry | Each | 1 | |
| CLNR-CLOTH | Lens cleaning cloth | Pupillometry | Each | 1 | |
| ELP-QR-USB-GOP | EyeLink 1000 Plus GOP Quick Restore USB Flash Drive with Instructions | Pupillometry | Each | 1 | |
| EL-DVEB | SR Research Experiment Builder and Data Viewer License | Pupillometry | Each | 1 | |
| SR-LANYARD | SR Research Lanyard | Pupillometry | Each | 1 | |
| SR-EYES-OCC1-V2 | Artifical Eye - Diameter 3.5mm w/ instructions | Pupillometry | Each | 1 | |
| EL-LS-35-71527-HS | EyeLink 1000 Plus High Speed 35mm Lens | Pupillometry | Each | 1 | |
| EL-HPC-USB-MOUSE | Host Computer USB Mouse | Pupillometry | Each | 1 | |
| EL-GL-CAM-CBL-5M-C2G | 15ft. Cat 6 Black 550 MHz Snagless Patch Cable | Pupillometry | Each | 1 | |
| EL-CBL-NET-10M-ST | 25ft. CAT6 Ethernet Cable - Blue Snagless Gigabit | Pupillometry | Each | 1 | |
| EL-PWS-V2 | Power Supply for EyeLink 1000 and EyeLink 1000 Plus (STDA25A-S05, UL-62368) | Pupillometry | Each | 1 | |
| ELP-QSG-STD512 | EyeLink 1000 Plus Quick Start Guide Workstation Host PC (5.12W) | Pupillometry | Each | 1 | |
| ELP-GUIDE-1020 | EyeLink 1000 Plus Installation Guide | Pupillometry | Each | 1 | |
| ELP-MANUAL-1020 | EyeLink 1000 Plus User Manual | Pupillometry | Each | 1 | |
| SR-FLASH-USB | SR Research USB Flash Drive containing the EyeLink Developer Kit (C/C++/Python/COM) and Camera SCD file | Pupillometry | Each | 1 | |
| EL-HPC-USB-KB | Host Computer USB Keyboard | Pupillometry | Each | 1 | |
| BB-MH-5-R2 | 5-button MilliKey USB button box w/ Quick Start Guide | Pupillometry | Each | 1 | |
| PC-PWR-CRD-NA | 6ft 5-15P to C13 power cable | Pupillometry | Each | 2 | |
| ELP-DESK-89 | EyeLink 1000 Plus Desktop Mount for Binocular High speed Tracking (up to 2000 Hz: Head stabilized) | Pupillometry | Each | 1 | |
| EL-DM890-HS | EyeLink 1000 Plus Desktop Mount for Binocular High speed Tracking | Pupillometry | Each | 1 | |
| 482C15 | 4-channel signal conditioner LW006403 | SCG | Each | 1 | |
| 034K10 | Mini 4-socket to (3) BNC plugs, 10 ft | SCG | Each | 1 | |
| 003D10 | BNC plug to BNC plug, 10 ft | SCG | Each | 3 | |
| 356A32 | Triaxial Accelerometer LW385387 | SCG | Each | 1 | |
| McKesson Non-Woven Sponges | General purpose (remove NuPrep gel, remove electrode gel, use with alcohol to clean locations, etc.) | Pack (100 pcs) | 1 | ||
| CURAD alcohol prep pads | Prep skin for ECG/EDA electrodes, clean after NuPrep application, subjects can use to get ECG/EDA off skin after study | Pack (4 box) | 1 | ||
| DB25 Parallel Male/Dual Female Y-splitter printer cable | Split parallel port from stimulus computer (signal sent to EEG & Biopac systems) | Each | 1 | ||
| 3 Panel Folding Room Divider | Split subject from researchers & data acquisition computers (if performing study in a single room) | Each | 1 | ||
| Isopropyl alcohol 99% | Clean equipment | Each | 2 | ||
| Paper towels | Clean equipment | Pack (8 pck)1 | 1 | ||
| Disposable hair combs | For subject to brush hair before EEG application | Pack (50 pk) | 1 | ||
| 9oz clear plastic cups | To get subjects water during breaks | Pack (50 pk) | 1 | ||
| Ethernet switch | Each | 1 | |||
| Self adhesive wrap bandages | Pack (6 pk) | 1 | |||
| Ethernet cable | Extra cables | Each | 2 | ||
| 3M Red Dot ECG Monitoring Electrodes 2670-3 | Collecting ECG, IP data | ECG | Case (600 electrodes) | 1 | |
| 3.5mm Mono to BNC Adapter (plug, NOT cable type) | Output of signal conditioner | Each | 3 | ||
| Single Parallel PCIe card | Sending trigger signals to EEG & Biopac | Each | 1 | ||
| Dell OptiPlex Tower Plus | 1 for stimulus presentation, 1 for Biopac & EEG data acquisiton | Each | 2 | ||
| Dell 24 Monitor (P2422H) | Biopac & EEG data acquisition | Each | 1 | ||
| Dell UltraSharp 27 Monitor - U2724D | Stimulus presentation | Each | 1 | ||
| Wooden table | Each | 1 | |||
| Shelves | Each | 1 | |||
| NIBP100D (CNAP) | To collect blood pressure (Georgia Tech used the NIBP100D-HD) | NICBP | Each | 1 | |
| CUSTOM | 600 Hour Finger Cuffs for NIBP100D-HD Module-Size Small | NICBP | 1 | ||
| CUSTOM | 600 Hour Finger Cuffs for NIBP100D-HD Module-Size Medium | NICBP | 1 | ||
| CUSTOM | 600 Hour Finger Cuffs for NIBP100D-HD Module-Size Large | NICBP | 1 | ||
| INISOA | Input signal isolation adapter; isolates CNAP from rest of Biopac system(only necessary if using the non-isolated HLT100C) | NICBP | 1 | ||
| DA100C | Collect EDA | EDA | 1 | ||
| PPGED-R | Collect EDA | EDA | 1 | ||
| LEAD110A | Collect EDA | EDA | 2 | ||
| EL507A | EDA electrodes | EDA | |||
| GEL101A | Isotonic electrode gel | EDA | Each | 1 | |
| Surgical Gown | Provided to participants who did not have loose-fitting clothing at study sessions | Each (per participant as needed) | 100 |
Safety warnings
Electrical Safety: Do not attach or detach EEG electrodes while the BioSemi amplifier is collecting data; this will corrupt data. Always check the CMS/DRL connection and electrode offsets before recording.
Psychological Distress Risk: The task includes emotionally evocative, depression-relevant content. Monitor participant behavior for distress. Be prepared to stop the session and notify clinical staff if necessary.
Cardiovascular Sensor Safety: CNAP cuffs may cause numbness or discomfort with prolonged use. Rotate fingers during breaks and avoid over-inflation or extended compression.
Signal Synchronization Risk: Incorrect or missing ecodes can compromise multimodal synchronization. Confirm triplet trigger transmission prior to task onset and use post-processing scripts to correct timing errors.
Eye Tracker Drift: Drift is common, particularly for glasses/contact users. Recalibrate if needed (between data collection blocks). If tracking fails repeatedly, continue session without eye tracking.
Signal Degradation: Motion artifacts, dried gel, or poor electrode contact can cause poor EEG/ECG signal. Re-gel or reposition electrodes if impedance increases or signals degrade during recording.
Motion Artifacts: Instruct participants to minimize movement during RSVP presentation. Sudden body movements can interfere with SCG, PPG, and EDA data.
Participant Fatigue: Sessions typically last 2.5–3 hours. Schedule short, self-paced breaks between stimulus blocks. If fatigue or disengagement becomes evident, offer extended breaks or discontinue the session.
Participant Safety First: Participant well-being overrides protocol completion. If emotional or physical discomfort arises, immediately halt data collection and follow established response procedures.
Ethics statement
This study followed the ethical principles of the Declaration of Helsinki. It was approved by the Institutional Review Boards (IRBs) at Emory University (STUDY00006938), the Georgia Institute of Technology (H23151), and Tufts University (STUDY00003388), as well as by the Navy’s Human Research Protection Office (HRPO). Each institution’s IRB and HRPO also oversaw participant recruitment. All participants gave written informed consent before joining the study.
Before start
Regulatory Readiness: Confirm all approvals are active and all team members have IRB and (if applicable) HRPO clearance.
Participant Screening: Rigorously screen participants against inclusion and exclusion criteria (e.g., psychiatric history, cardiac conditions, medication use). Confirm eligibility through structured clinical interview (if applicable).
System Checks: Verify function and calibration of EEG, Biopac, CNAP, and EyeLink systems. Ensure optical connections (BioSemi), wireless module pairing (Biopac), and parallel port trigger transmission (PsychoPy) are functioning.
Participant Instructions: Advise participants to limit caffeine intake, and avoid alcohol and hair products on the day of the session. Recommend wearing comfortable, loose-fitting clothing to allow easy access for body-attached sensors.
Crisis Protocol Preparedness: Ensure that mental health support personnel, crisis protocols, and emergency contacts are available during all sessions. All team members must know how to respond to signs of participant distress or dysregulation.
Informed Consent: Confirm comprehension and voluntary participation, even if informed consent was collected during remote screening. Participants must be reminded they may withdraw at any time without penalty.
Introduction
Background and Rationale
Mental health conditions such as Major Depressive Disorder (MDD) and suicidality are widespread, complex, and difficult to assess accurately using current clinical tools. While self-report questionnaires and clinical interviews are commonly used for diagnosis, these methods are inherently limited by their dependence on conscious introspection, subjective recall, and social desirability bias. Such constraints often obscure underlying mental states, particularly those such as depression and suicidality, which are rooted in deep cognitive and emotional processes that occur outside of conscious awareness yet strongly influence perception, mood, and behavior.
Traditional mental health evaluations rely heavily on explicit self-disclosure and clinician interpretation. While useful, they fail to detect subtle or unconscious signals of distress, which can be particularly problematic in at-risk individuals. These assessments are also often difficult to administer at scale, and not readily adaptable to diverse populations or field settings. Moreover, individuals with depression may underreport symptoms or lack insight into their condition, further diminishing diagnostic accuracy.
Advancements in neuroscience, psycholinguistics, and physiological sensing have significantly enhanced our ability to study preconscious cognitive processes—mental operations that occur outside of conscious awareness but nonetheless shape perception, emotion, and belief formation. By leveraging multimodal sensing technologies, it is now possible to observe these processes at both central and peripheral levels of the nervous system. Tools such as electroencephalography provide high temporal-resolution measures of semantic and affective processing. In parallel, autonomic signals such as heart rate variability, captured by electrocardiography; electrodermal activity; eye tracking; and respiration provide complementary insight into arousal and attentional states. When synchronized with structured psycholinguistic stimuli designed to elicit self-relevant or emotionally valenced responses, these modalities enable the identification of objective biomarkers that extend beyond the limitations of self-report.
Development of the Protocol
The PRESCRIBE (Preconscious Signal Compilation for Robust and Individualized Belief Evaluation) study was conducted under the DARPA (Defense Advanced Research Projects Agency) NEAT (Neural Evidence Aggregation Tool) program to overcome the limitations of traditional psychiatric assessments by leveraging a multimodal, neurophysiological, psycholinguistic, and electrophysiological approach. The central aim of PRESCRIBE was to investigate how individuals with and without depression respond to emotionally salient, self-referential stimuli and to determine whether these responses reveal objective measures of symptoms experienced by individuals that correlate with mental health risk. Specifically, the study sought to identify neural and autonomic markers associated with the implicit confirmation or disconfirmation of self-relevant beliefs in individuals with depression, thereby improving the sensitivity and specificity of risk detection.
Conceptual Motivation and Research Hypotheses
PRESCRIBE was developed in response to the growing recognition that many psychiatric conditions—particularly affective disorders such as MDD, Post-Traumatic Stress Disorder (PTSD), and suicidality—involve cognitive and emotional processes that operate outside of conscious awareness and are not reliably captured through introspective self-report or clinical interviews. By integrating structured linguistic stimuli with high-temporal-resolution physiological monitoring, the study aimed to uncover how individuals implicitly process emotionally salient, self-relevant content. The overarching objective was to establish an empirically grounded framework for assessing mental health risk via psychophysiological signals. By systematically linking belief processing to measurable neurophysiological responses, PRESCRIBE sought to enable early detection, risk stratification, and monitoring of mental health conditions.
The primary hypothesis was that individuals with depression would show distinct neurophysiological response patterns—especially in electroencephalogram (EEG)-derived event-related potentials (ERPs) such as the N400, Late Posterior Positivity (LPP), and Late Frontal Positivity (LFP)—when confronted with symptom-relevant stimuli. These components reflect semantic expectancy violations, emotional salience, and cognitive processing. A secondary hypothesis posited that autonomic indicators such as heart rate variability (HRV), electrodermal activity (EDA), eye tracking, and/or respiration would correlate with symptom severity and differ reliably between individuals with MDD and healthy controls.
Overview of the Protocol’s Scope
The PRESCRIBE protocol employed a psycholinguistic experiment featuring sentence vignettes designed to evoke depression-relevant themes in both self-referential and non-self-referential forms. During the task, physiological data were simultaneously collected across multiple modalities, including EEG, electrocardiogram (ECG), photoplethysmogram (PPG), seismocardiogram (SCG), EDA, respiration, continuous non-invasive blood pressure, and eye tracking.
The experimental design was fully counterbalanced in terms of vignette presentation and temporally synchronized, enabling high-resolution alignment between the presentation of linguistic stimuli and corresponding neural and physiological responses.
Participants were recruited across three study sites—Tufts University (Tufts), Georgia Institute of Technology (Georgia Tech), and Emory University (Emory). Although each site conducted data collection independently, all followed a standardized protocol with harmonized methodologies to ensure consistency and interoperability across datasets. The study protocol was initiated in February 2023 and concluded in January 2025. A total of 105 participants were enrolled in the study, resulting in a rich, multimodal dataset comprising synchronized brain, cardiac, autonomic, and ocular signals during exposure to belief-relevant linguistic stimuli (Table 1).
Table 1: Summary of datasets collected across three recruitment sites using the PRESCRIBE protocol. HC denotes healthy controls, and MDD denotes Major Depressive Disorder.
| A | B | C | D | E | F | G | H | I | J | |
| Site | Cohort | N (N female/ N male) | Age Mean (SD) | BDI Score Mean (SD) | STAI-S Score Mean (SD) | STAI-T Score Mean (SD) | PHQ-9 Score (Average) | MINI-Current MDE Score (Average) | MINI-Suicidality Score (Average) | |
| Tufts | HC | 40 (21/19) | 26 (12.15) | 5.55 (5.71) | 31.64 (7.72) | 34.78 (8.66) | Not collected | Not collected | Not collected | |
| Georgia Tech | HC | 30 (12/18) | 30.53 (7.91) | 6.9 (8) | 31.73 (6.33) | 37 (9.21) | 3.53 (4.49) | Not collected | Not collected | |
| Emory | HC | 10 (6/4) | 36.20 (17.18) | 16.00 (8.39) | 44.61 (5.90) | 47.12 (4.47) | 7.10 (3.54) | 0 (0) | 0.20 (0.42) | |
| Emory | MDD | 25 (17/8) | 37.91 (14.85) | 30.76 (9.75) | 42.80 (9.85) | 44.63 (9.91) | 15.32 (4.71) | 6.44 (2.31) | 8.52 (15.76) |
This comprehensive dataset supports the development of machine learning (ML) models capable of detecting depression-related risk signatures from physiological responses alone, potentially enabling scalable, non-invasive mental health screening tools that do not rely on self-report. To date, key findings from the study have been disseminated in several publications [Sharpe 2025, Stone 2025, Karimi 2025], and the analysis of the various physiological and neural sub-modalities remains ongoing.
To ensure transparency, reproducibility, and broad applicability, this protocol paper documents the full experimental pipeline—including participant selection, stimulus design, sensor integration, synchronization procedures, and session logistics—providing a detailed resource for researchers seeking to implement or extend the PRESCRIBE framework in either research or clinical contexts.
Consortium Collaboration and Study Goals
PRESCRIBE was a collaborative effort among Emory, Georgia Tech, Tufts, and Charles River Analytics (Charles River), with each institution contributing complementary expertise. Tufts led the design and development of the psycholinguistic stimuli. Georgia Tech designed the multimodal physiological data acquisition setting. Emory led clinical recruitment and validation with psychiatric populations (individuals diagnosed with MDD). Charles River managed the project, coordinated among the sites and with DARPA and other NEAT program performers, developed computational pipelines for data analysis and model training, and led the system integration effort. All teams contributed to data sharing, joint analysis, and iterative refinement of the protocol.
Multimodal Design Considerations
Developing the PRESCRIBE protocol required addressing several interdependent challenges: (1) crafting linguistically effective and depression symptom -relevant stimuli; (2) synchronizing diverse physiological data streams with sub-millisecond accuracy; and (3) ensuring participant comfort during extended recording sessions. Vignettes were designed to reduce cognitive burden while maintaining contextual richness and targeted self-referential belief content. Tasks required minimal participant effort—primarily simple button-press judgments—to preserve spontaneous neural reactivity while maintaining engagement.
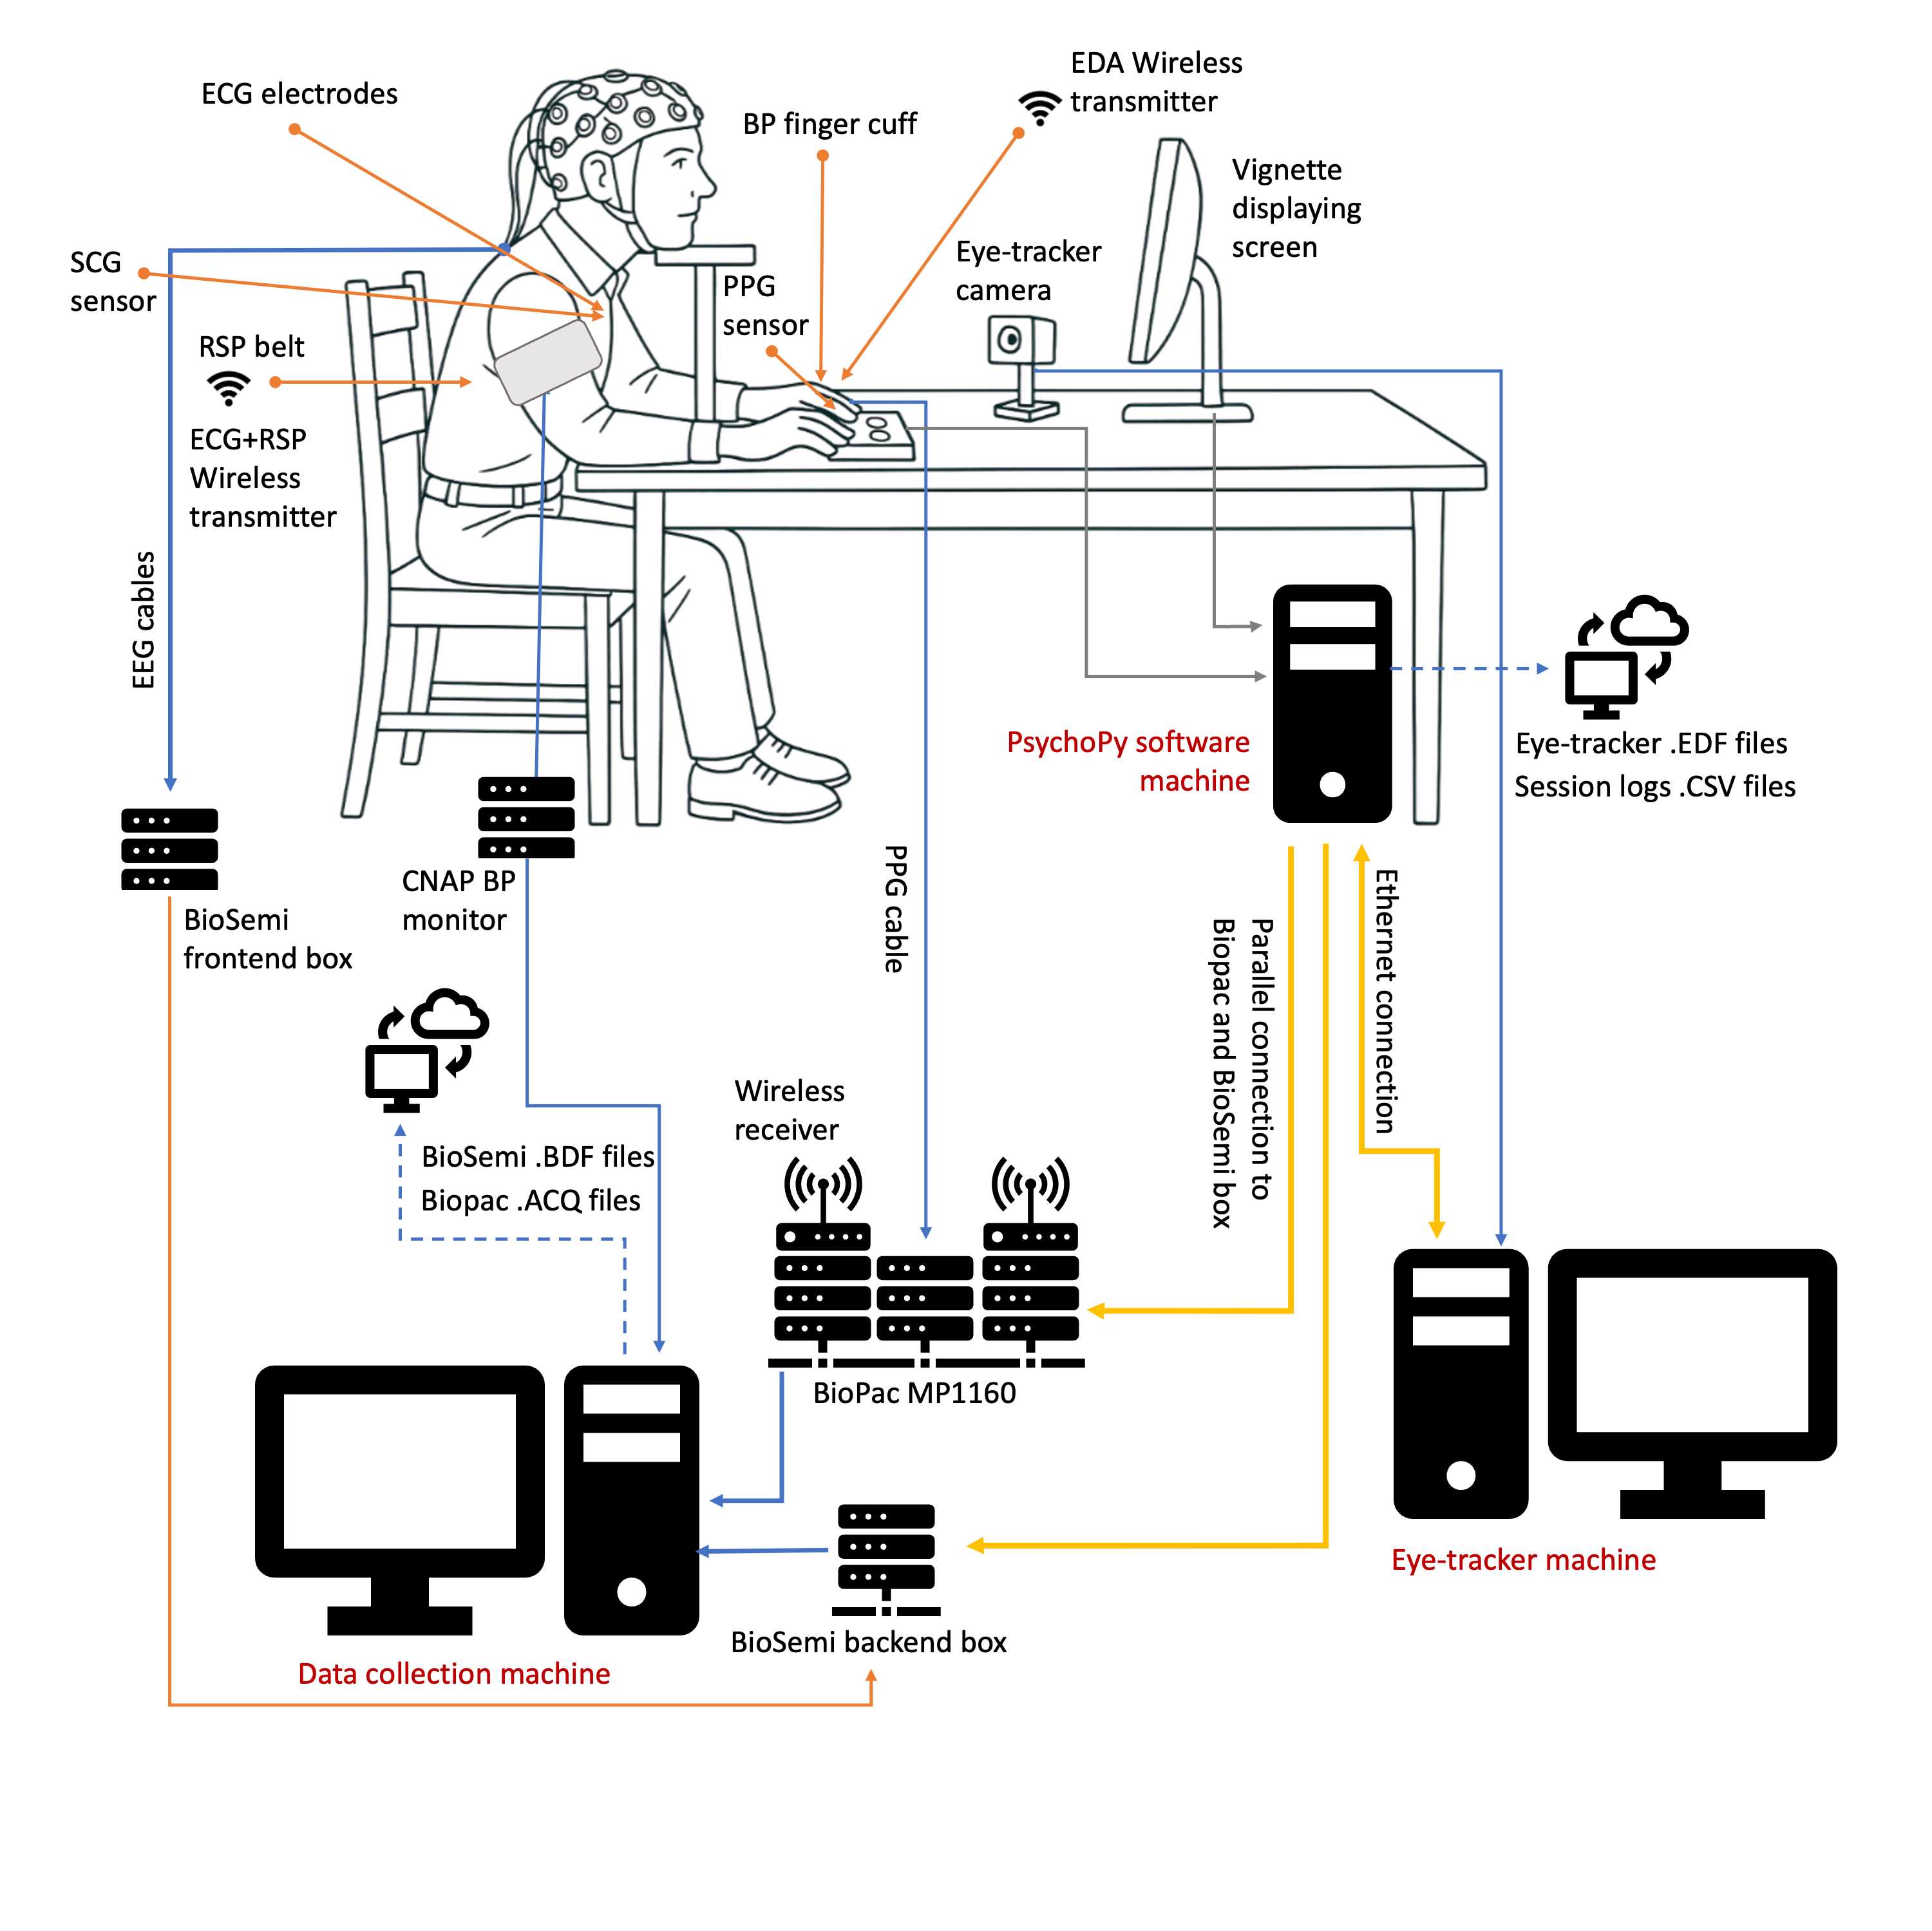
Physiological data were captured using a comprehensive suite of non-invasive sensors: a 32-channel EEG system (plus two to four accessory face electrodes), ECG, PPG, SCG, and EDA sensors, a respiratory belt, noninvasive continuous blood pressure (NICBP) cuff, and infrared-based eye tracking. All sensors were synchronized through hardware (TTL pulses, parallel port triggers) and software tools (custom PsychoPy and MATLAB scripts), allowing precise alignment of stimulus presentation with physiological responses.
Participant comfort and data quality were prioritized through iterative sensor placement optimization, including adjustments for skin contact, signal stability, and usability during long sessions (2.5–3 hours). A User Comfortability Questionnaire was used to assess and improve ergonomics.
Pilot Testing and Protocol Refinement
Before launching full-scale data collection, the protocol was pilot-tested with healthy controls to refine timing, language, sensor placement, and procedural flow. Pilot results led to key adjustments: (1) simplifying sentence construction to improve readability; (2) increasing inter-stimulus intervals to reduce ERP overlap; and (3) optimizing ergonomics for facial electrodes and finger sensors.
Participant feedback was also used to enhance environmental factors such as screen positioning and lighting, improving both comfort and signal quality, particularly for eye tracking measures. Task structure was calibrated to maintain engagement and reduce fatigue through strategically placed breaks between stimulus blocks. These refinements ensured both scientific validity and participant compliance, setting the stage for reliable large-scale deployment across both clinical and non-clinical cohorts.
This paper documents the final iteration of the PRESCRIBE protocol, incorporating all modifications from pilot testing and site-specific implementation feedback.
Applications of the method
The PRESCRIBE protocol has broad implications across multiple research and clinical domains due to its integration of psycholinguistic stimuli with multimodal biosignal acquisition. The design and objectives of the study enable applications that extend beyond its immediate scope in neuropsychiatric research. Notable areas of applicability are discussed below.
Prescreening for Depression and Suicidality
One practical application of the PRESCRIBE protocol is early screening for depression and suicidality, particularly in populations where self-reporting may be unreliable due to stigma or other barriers. By measuring preconscious brain responses to emotionally meaningful language—captured through EEG signals such as the N400, LPP, and LFP—the protocol provides insight into how individuals process self-referential and emotionally charged content. These neural measures are complemented by physiological data from wearable sensors like ECG, SCG, and PPG, which track cardiac activity, heart rate, and blood flow changes linked to stress and emotional arousal. In addition to supporting EEG-based assessments, modalities such as ECG, SCG and PPG can also be used independently in simplified, lower-cost versions of the protocol. This flexibility opens the possibility for more accessible, scalable screening tools that can be deployed outside of laboratory settings—such as in primary care, community clinics, or field environments.
In [Karimi et al., 2025], the ECG and PPG data collected as part of the PRESCRIBE project were used to explore the feasibility of prescreening depression using wearable, low-cost ECG and PPG sensors. Signals from 60 participants (from Emory and Georgia Tech sites) were analyzed alongside their BDI-II and PHQ-9 depression scores. Time intervals derived from ECG and PPG, such as R-to-R peak intervals (RR), systolic, and pulse durations, were used to extract short-term variability features. These features—especially SD1 from RR and systolic intervals—were found to be discriminative between healthy and depressed groups. SD1 is derived from Poincaré plots and quantifies short-term, beat-to-beat variability driven by parasympathetic activity, while SD2 has been associated with longer-term variability influenced by both autonomic branches [Brennan 2001]. ML models, particularly SVM, classified depression risk with high accuracy (AUROC 0.83 for BDI-II, 0.78 for PHQ-9). SHAP analysis confirmed the most predictive features. The study demonstrated that simple, wearable ECG and PPG sensors can help detect depression risk reliably and non-invasively.
In [Stone 2025], we used EEG-derived ERPs from the PRESCRIBE project to identify objective neural markers of depression. We focused on three ERP components—LFP, N400, and LPP—to analyze brain responses to emotionally and semantically charged stimuli. ML models trained on these features classified MDD with 80% accuracy, 78% sensitivity, and 83% specificity. The LPP was the strongest predictor of clinical diagnosis, while LFP and N400 features better tracked depression severity as measured by BDI and PHQ-9 scores. These results show that distinct neural patterns differentiate clinical depression from self-reported symptoms and support ERPs as scalable, objective tools for both psychiatric evaluation and basic research on attention, prediction, and emotion.
Cognitive and Affective Neuroscience Studies
The protocol’s integration of linguistic expectancy violations with EEG, eye tracking, and other physiological signals provides a novel approach to probing emotional processing. This makes it highly applicable to fundamental research in cognitive and affective neuroscience. Researchers can adapt the stimuli and analysis methods to explore questions in many other domains such as attention, memory, and emotional reactivity, thereby enriching our understanding of the brain’s early-stage responses to emotionally and personally relevant content. This could be relevant to other mental health disorders (e.g., PTSD, anxiety, or eating disorders).
Multimodal Biomedical Signal Processing and Machine Learning (ML) Research
In addition to its primary aims, the PRESCRIBE protocol produces a rich, time-synchronized dataset of multimodal physiological signals—including EEG, ECG, PPG, EDA, NICBP, SCG, respiration, and eye tracking (only EEG was collected at Tufts). This comprehensive dataset not only supports research in neural development, brain-body interaction, and cerebro-cardiovascular dynamics, but also serves as a valuable resource for advancing multimodal biomedical signal processing and ML methodologies. With precise alignment between physiological responses, annotated linguistic events, and psychometric ground truth measures, the protocol provides a framework for developing and validating algorithms focused on multimodal feature extraction, sensor fusion, artifact reduction, and data-driven modeling of human affective and cognitive states.
Wearable Health Technology Development
With its use of wearable sensors and real-time biosignal collection during semi-naturalistic tasks, the protocol serves as a proof-of-concept for next-generation health monitoring systems. Insights from this research can inform the design of wearable platforms capable of detecting changes in mental health status, stress, or emotional well-being. Furthermore, the protocol’s emphasis on user comfort ensures that future devices consider both accuracy and usability—key requirements for long-term adoption in clinical and non-clinical settings.
Comparison with Similar Methods
Multiple studies have explored physiological and behavioral biomarkers for depression detection, typically using a limited set of modalities and varying diagnostic assessments.
[Hosseinifard 2013] used EEG recordings from 19 scalp electrodes to classify participants. Diagnosis was based on a DSM-IV clinical interview and a BDI score ≥10. The EEG data was recorded in resting state with closed eyes for 5 minutes. The study included 90 participants (45 depressed, 45 controls).
[Kim 2018] collected EDA during five experimental cases including baseline, mental arithmetic task, recovery from the stress task, relaxation task, and recovery from the relaxation task. The study did not report the use of any standardized scores like BDI-II or PHQ-9, and participants were grouped based on clinical diagnoses. The study involved 67 participants (30 depressed, 37 controls).
[Yang 2023] employed a wearable eye-tracking device allowing for naturalistic, free-browsing behavior without the need for head fixation. MDD/healthy labeling was based on the Mini-International Neuropsychiatric Interview (MINI), with MDD diagnoses confirmed by at least one clinical psychiatrist. Participants were presented with image stimuli, including positive, neutral, and negative pictures, to examine attentional biases commonly observed in depressive people. This design leveraged established findings that individuals with depression show less attention to positive stimuli and increased sensitivity to negative content. The study had 89 participants in total (45 depressed, 44 controls).
[Alzate 2024] used ECG and PPG signals collected via wearable sensors to classify MDD patients vs healthy controls. Participants were first screened using a preliminary verbal affirmation (as a control biomarker), where they reported any prior diagnosis or depressive symptoms in the past two weeks in the presence of a psychiatrist. To prevent false positives, this was followed by the BDI-II assessment, with a score of ≥14 (indicating at least mild depression) used to confirm depressive status. Individuals meeting either criterion were labeled depressive while those who met neither were classified as normal. The experimental protocol used “Script-Driven Imagery”, in which participants read emotionally evocative or neutral scripts and then closed their eyes to imagine the described scenarios. The study included 59 participants (30 depressed, 29 controls).
[Hunt 2003] recruited 238 community members from the City of Philadelphia to participate in a study about “life stress,” with the concealed aim of examining self-report bias for depression. The researchers instructed half of the subjects to fill out a “Depression Inventory”—the BDI-II with 14 additional filler items related to depression (overt condition)—and the other half to fill out a “Life Stress Inventory”—the BDI-II with 14 additional filler items related to mild life stressors (covert condition). They found significantly fewer self-reports of depressive symptoms when the BDI-II was overtly administered than when it was covertly administered, highlighting self-report bias.
In contrast, the PRESCRIBE protocol integrates a broader and more diverse set of synchronized physiological signals—including EEG, ECG, PPG, SCG, NICBP, respiration, EDA, and eye tracking—collected in parallel with structured psycholinguistic tasks, with depression severity assessed using standardized clinical scales such as the PHQ-9 and BDI-II. Hypothetically, mental health assessments typically occur after symptoms significantly impact one’s life and relationships. In addition, screening relies on self-report of symptoms, which is susceptible to misreporting (e.g., due to stigma, cognitive impairments, difficulty expressing oneself), justifying the PRESCRIBE protocol’s approach in collecting multiple physiological modalities.
Additionally, to our knowledge, PRESCRIBE is the first protocol which uses naturalistic, depression-relevant vignettes in conjunction with EEG to probe a wide variety of depressive symptoms. However, a small number of previous studies have measured neural activity while healthy controls and MDD patients read short self-relevant phrases which varied in emotional valence [Kiang 2017, Klumpp 2010].
Various vignette presentation protocols have also been explored in the literature. [Klumpp 2010] presented sentence stems such as “Today I am feeling...” followed by either a positive (e.g., happy), negative (e.g., sad), or neutral (e.g., okay) sentence-final word to MDD patients, dysthymic patients, and healthy controls while EEG was recorded. After each trial, participants indicated whether or not they felt that the adjective described them via button press (Y/N). In the results, no group differences were found in the EEG N400 component amplitude to negative words between healthy controls and depressed groups.
[Kiang 2017] presented the short self-referential phrase “I am…” followed by a positive (e.g., loyal, friendly), negative (e.g., helpless, stupid), or neutral (e.g., hungry, modest) adjective while EEG was recorded in both patients with MDD and healthy controls. Participants indicated whether or not they felt that the adjective described them via button press (Y/N) after each trial. Patients were shown to have significantly smaller N400 amplitudes to negative adjectives compared to healthy controls; however, the interaction between Group and Valence did not reach significance.
Experimental Design Overview
The experimental design integrated psycholinguistic stimuli with simultaneous physiological and neurophysiological recordings. Participants viewed sentence vignettes on a monitor designed to elicit responses to self-referential and non-self-referential content related to depressive themes. Responses were collected via a three-button keypad with randomized key configurations (YES-GO-NO or NO-GO-YES) to minimize motor response bias. Participants were instructed to keep their gaze fixed on the screen throughout the task to maintain data quality across all modalities, particularly eye tracking.
Stimuli were presented using PsychoPy software, which also controlled stimulus timing and delivered synchronization triggers to all recording systems. These included EEG (BioSemi), physiological sensors (Biopac), and eye-tracking (EyeLink 1000 Plus). Each participant completed one of 16 counterbalanced stimulus lists. Trials were structured to include a fixation cross, stimulus presentation, response collection, and a variable inter-trial interval to reduce temporal predictability.
The recorded signals included:
- Electroencephalogram (EEG) via BioSemi ActiveTwo system with a 32-channel EEG cap
- Eye-tracking (and pupillometry) via EyeLink 1000 Plus system
- Electrocardiogram (ECG) via Biopac BN-RSPEC wireless leads
- Photoplethysmogram (PPG) via finger clip sensor
- Respiration via thoracic respiration belt
- Seismocardiogram (SCG) via chest-mounted triaxial accelerometer
- Electrodermal activity (EDA) via palm electrodes
- Continuous non-invasive blood pressure (CNAP) via finger and upper arm cuffs
All devices were hardware- and software-synchronized to allow precise temporal alignment of stimulus events with neural and physiological responses. Calibration and validation were performed before each stimulus block to ensure eye tracking accuracy. Each experimental session lasted approximately 2.5 to 3 hours, including setup, calibration, task completion, and scheduled breaks. All participants were tested in the same physical environment with controlled lighting and standardized equipment layout to minimize variability.
Expertise Needed to Implement the Protocol
The protocol can be implemented by trained graduate students or postdoctoral researchers with backgrounds in any area of research involving sensor applications, with EEG being the most challenging sensor to apply. This includes fields such as neuroscience, cognitive science, biomedical engineering, electrical engineering, or computer science. Given the complexity and diversity of the modalities used, the implementation team must be closely supervised by experienced faculty with expertise in psychiatric research, physiological data collection, and biosignal analysis.
In PRESCRIBE, at all three data collection sites (Georgia Tech, Emory, and Tufts), sessions were conducted by graduate students and postdocs under the direct supervision of site principal and co-investigators. These researchers were proficient in biomedical sensor setup, software tools, signal troubleshooting, and participant-facing procedures.
At Emory University, subject recruitment and remote screening were conducted by trained graduate researchers and staff affiliated with the Emory Brain Health Center. These team members had backgrounds in psychology and biomedical informatics and were experienced in administering structured clinical interviews and psychological assessments.
Implementation was supported by regular cross-site coordination. Technical issues, procedural updates, and site experiences were reviewed during weekly meetings between all three university teams and the project leads at Charles River. In addition, three in-person site visits were conducted to align procedures and cross-check protocol fidelity across all locations.
The project was closely mentored by faculty with expertise in clinical psychiatry, biomedical and electrical engineering, and computer science. Several engineers and scientists with PhDs in biomedical engineering, psychiatry, computer science, and data science from Charles River also contributed to data infrastructure, troubleshooting, and analysis.
The protocol was designed to be carried out by two trained team members working in parallel—particularly during sensor application and quality checks—for efficiency and data quality. While a single researcher can perform all steps with extended time, this is not recommended due to increased risk of error and participant burden.
Importantly, psychiatric conditions often present with comorbidities and symptoms that may result in unexpected fatigue, irritability, emotional distress, or behavioral complications. It is strongly advised that all personnel involved in data collection be thoroughly trained not only in technical procedures but also in safety, legal, and ethical guidelines related to human subjects research, and IRB requirements. They should be prepared to respond appropriately to participant distress or behavioral crises and must have access to emergency contact numbers and procedures. In the event of participant dysregulation or potential risk to safety, the team should immediately stop data collection and contact site clinicians or emergency services as appropriate.
Procedure
The procedures involved in subject recruitment and data collection using the different subsystems are detailed in this section.
Participant Recruitment
Participants were recruited through a two-stage process at Emory, Georgia Tech, and Tufts. Recruitment was conducted via public advertisements, including flyers and digital platforms. Initial eligibility screening was completed remotely or on the phone across all sites. Participants who met preliminary inclusion criteria were invited to provide informed consent and complete psychological prescreening measures.
Emory used the REDCap platform to collect and organize surveys and subject recruitment questionnaires. Georgia Tech and Tufts used printouts later transcribed by study coordinators onto cloud-based spreadsheets.
Inclusion and Exclusion Criteria
Eligible participants were between 18 and 75 years of age and had more than 50% exposure to English before the age of five. Participants were either diagnosed with MDD by an expert or self-reported no current or past psychiatric diagnoses/disorders and served as healthy controls.
Exclusion criteria included: a history of neurological disorders such as traumatic brain injury or meningitis; cognitive impairments; significant substance use disorders within the past year (excluding nicotine); head trauma with loss of consciousness exceeding one minute; a history of cardiovascular disease (having a heart condition or having had heart problems in the past, in addition to currently taking heart or vascular medication); current pregnancy or breastfeeding; and certain psychiatric diagnoses, including schizophrenia, obsessive-compulsive disorder, and bulimia nervosa; or having an active implanted medical device. Participants currently using central nervous system–affecting medications, such as benzodiazepines or opioids, or taking any prescription drugs to treat any mental disorders were also excluded. Individuals with insufficient English proficiency, or those affiliated with the Department of Defense (which was the funding agency), were not eligible.
Final eligibility was confirmed through clinical review by a licensed clinician or trained screening personnel, with discretion allowed in borderline cases.
Participant Groups
Participants were divided into two groups: individuals diagnosed with mental health disorders and healthy controls who reported no current (within the past year) psychiatric diagnosis. Clinical participants were recruited through Emory University’s psychiatric outpatient clinic, while healthy controls were identified through community advertisements and university-affiliated sources.
Clinical and Psychological Assessment
All participants completed psychological screening measures before the experimental session. These included the BDI-II [Beck 1961, Beck 1996] and the PHQ-9 [Levis 2019], both widely used instruments for assessing depressive symptom severity. At Emory, additional diagnostic evaluation was conducted using the MINI) [Baker 1998], a structured diagnostic interview administered by trained personnel to confirm psychiatric status and verify eligibility. At Emory, supplementary assessments were conducted to evaluate baseline psychological functioning across domains including trauma exposure, stress, and anxiety, using the State-Trait Anxiety Inventory (STAI), Eysenck’s Test of Intelligence (ETI) [Eysenck 1979], and the Perceived Stress Scale (PSS) [Cohen 1983]. STAI and PSS were also conducted at Georgia Tech. Together, these assessments provided a detailed baseline profile of each participant’s psychological status prior to the experimental task.
Stimulus Design
The N400, LPP/P600), and LFP ERPs are neurophysiologic markers of the preconscious processing of linguistic stimuli. These three ERP components are known to be sensitive to violations of expectations (i.e., beliefs) related to the semantic and affective content of language (see Table 2). In PRESCRIBE we aimed to assess whether these components, along with other physiological signals, evoked by short vignettes presented to participants on a computer screen, could predict symptoms of depression and/or suicidality.
Table 2: EEG channels, markers of interest, and hypothesized contributions
| EEG Channels | Markers of Interest | Hypothesized Contribution | |
| Centroparietal electrodes, from 250-450 ms after CW onset | N400 ERP | Sensitive to predictability/expectancy as a function of real-world knowledge and self-relevant beliefs | |
| Posterior electrodes, from 550-1000 ms after CW onset | Late Posterior Positivity (LPP) ERP | Sensitive to expectancy and implicit emotional and motivational significance; also linked to phasic release of norepinephrine | |
| Frontal electrodes from 550-1000 ms after CW onset | Late Frontal Positivity (LFP) ERP | Sensitive to “frame-shifting” in response to unpredicted information |
We hypothesized that first-person vignettes—referred to as self-relevant (SR) probes—depicting self-negative mental states (consistent with depressive or suicidal symptomology) would violate the semantic and affective expectations of individuals with predominantly self-positive beliefs (i.e., those without depressive symptoms). Conversely, we hypothesized that SR probes reflecting self-positive mental states would violate the expectations of individuals with predominantly self-negative beliefs (i.e., those with symptoms of depression), resulting in measurable differences in ERP and physiological signals.
In contrast, we expected that non-self-relevant (NSR) probes—written in the third person and therefore not directly targeting self-beliefs—would not differentially modulate neurophysiological signals between individuals with self-positive versus self-negative belief structures. This distinction rationalized the use of NSR responses as a form of “ground-truth” prior, isolating belief-specific responses in the SR condition.
The full stimulus set consisted of 3–4 sentence vignettes, including 160 SR scenarios and 160 NSR scenarios. Each vignette included a context section (comprising all but the final sentence) and a target sentence, which ended with a critical word (CW). The context was designed to set up an expectation about the final sentence, in particular the CW, which carried the key semantic or emotional information. In NSR stimuli, the context also introduced a fictional third-person character to minimize personal relevance (see Table 3).
The target sentence always included the CW, which was either predictable or surprising depending on the beliefs being probed. Each scenario was associated with a unique pair of CWs—one pleasant (e.g., clear) and one unpleasant (e.g., foggy). We manipulated which CW appeared at the end of the target sentence to modulate the outcome of the vignette: in SR probes, the CW outcome was either self-positive or self-negative; in NSR probes, it was either expected or unexpected (see Table 3). That is, in SR probes, the CW either confirmed or contradicted participants’ subjective expectations based on their internal beliefs. In NSR probes, the CW was simply congruent or incongruent with the context, without being tied to the participant’s self-view. Both SR and NSR probes used the same CW pairs. While these CWs varied in emotional valence (by design), they were matched for emotional arousal (Warriner et al., 2013). Emotional valence refers to whether an emotion is positive or negative, while emotional arousal reflects the intensity or level of activation associated with that emotion. Our design ensured that any observed effects can be more confidently attributed to differences in emotional valence rather than differences in arousal.
Table 3: Example probe types and vignettes
| A | B | |
| Probe Type | Example Vignette | |
| NSR expected, pleasant CW | Sometimes people's minds feel clear while at other times they feel foggy. James has been very focused and on the ball lately. His mind has felt really clear. | |
| NSR unexpected, unpleasant CW | Sometimes people's minds feel clear while at other times they feel foggy. James has been very focused and on the ball lately. His mind has felt really foggy. | |
| SR self-positive, pleasant CW | At different moments in life, people's mental clarity can vary quite a lot, particularly in relation to their mood. When feeling content, one's thought processes can feel really clear. But when things are overwhelming, one's mind can feel pretty foggy. Lately my mind has been quite clear. | |
| SR self-negative, unpleasant CW | At different moments in life, people's mental clarity can vary quite a lot, particularly in relation to their mood. When things are overwhelming, one's mind can feel pretty foggy. But when feeling content, one's thought processes can feel really clear. Lately my mind has been quite foggy. |
We designed CWs to correspond to constructs found in depression-related subscales commonly assessed via surveys and clinical interviews. These included cognitive-affective and somatic-performance constructs, as well as symptomatic expressions such as sleep disturbance, hopelessness, anxiety, irritability, or guilt. Stimuli were explicitly designed to map onto constructs derived from DSM-5 criteria and validated depression rating scales. As Table 3 shows, this allowed us to probe preconscious beliefs related to symptom domains, aligning linguistic triggers with established diagnostic frameworks.
To finalize the set of depression-related constructs, we cataloged all items listed under the Diagnostic and Statistical Manual, 5th edition (DSM-5) criteria A and B for Major Depressive Disorder, alongside five widely used clinical instruments: BDI-II, Hamilton Depression Rating Scale (HDRS), Montgomery–Åsberg Depression Rating Scale (MADRS), Columbia Suicide Severity Rating Scale (C-SSRS), and the Suicide Behaviors Questionnaire (SBQ). Using a list of candidate symptom domains developed by Dr. Kuperberg (a board-certified psychiatrist), we retained only those constructs appearing in at least two of the five scales. The final set of symptom domains and their associated scale items are shown in Table 4. While C-SSRS and SBQ were not included in Table 4 due to their exclusive focus on suicidality, their content was incorporated during stimulus development to ensure full coverage of suicide-related symptomatology. We also included two additional constructs: Past Risk Factors and Present Risk Factors, based on categories defined in Chu et al. (2015), which reflected previous life events (e.g., trauma, past suicidality) and current life circumstances (e.g., social isolation), respectively.
Table 4: Symptom constructs and items in which they appear that are used in our presentation stimuli. Note that the CSSR and SBQ are not listed here, as they both deal exclusively with suicide and suicide risk. However, the different items in these scales were considered when generating stimuli, so that we were able to probe a variety of aspects of suicidality.
| A | B | C | D | E | F | G | |
| Construct | DSM Criterion | BDI [Item] | HDRS [Item] | MADRS [Item] | Definition | N Stimuli | |
| Mood | A1 | 1,10 | 1 | 1, 2 | Depressed mood, feeling sad, empty, hopeless, gloom, despair. Crying more than usual or feeling like crying but unable to. | 35 | |
| Anhedonia | A2 | 4, 12 | 8 | Diminished or loss of interest/pleasure in surroundings, activities that normally give pleasure, or people. Possible emotional numbness. | 9 | ||
| Appetite | A3 | 18 | 12, 16 | 5 | Significant decrease or increase in appetite. May need persuasion to eat or requests for medication for bowels or gastro-intestinal symptoms. | 4 | |
| Sleep | A4 | 16 | 4, 5, 6 | 4 | Insomnia or Hypersomnia. May also be poor quality, amount, and timing of sleep. Could range from difficulty falling asleep, staying asleep, or ability to fall asleep again. | 2 | |
| Psychomotor | A5 | 8 | [ Psychomotor agitation (restlessness); psychomotor retardation (slowing) | 3 | |||
| Fatigue | A6 | 15, 20 | Extreme tiredness, loss of energy. Fatigue with lack of ability to accomplish things [may dip into functioning]. | 11 | |||
| Guilt | A7 | 5, 6 | 2 | 9 | Feelings of worthlessness, excessive/inappropriate guilt, regrets, rumination over past errors, inferiority, remorse, or ruin that is far beyond normal limits. | 11 | |
| Cognitive | A8 | 13, 19 | 6 | Diminished ability to think, concentrate, or make decisions. May also affect one's ability to do simple things like reading or conversing. | 12 | ||
| Suicidal Thoughts & Behaviors | A9 | 9 | 3 | 10 | Thoughts that are: suicidal, wishing for death, life is not worth living, a natural death would be welcome in the present moment, ideation/gestures, attempts (regardless of action status), or preparations. Frequent thoughts of death. Physical self-harm. | 10 | |
| View of Self | 3, 7, 14 | Self-dislike, self-criticality, feelings of worthlessness | 16 | ||||
| Anxiety | 17 | 10, 15 | 3 | Inner tension; irritability | 16 | ||
| Libido | 21 | 14 | Loss of interest in sex or decreased sex drive. | 2 | |||
| Functioning | B | 7 | 7 | Significant distress or impairment in social, occupational, or other important areas of functioning. May also include decrease in productivity, complete stop of it, or difficulty getting started, initiating, or performing everyday activities. | 11 | ||
| Somatic | 12, 13 | Bodily aches; Issues surrounding: Gastro-intestinal, cardio-vascular respiratory, urinary frequency, sweating, pain, heaviness | 6 | ||||
| Past Risk Factor | See [Chu et al., 2015] | 8 | |||||
| Present Risk Factor | See [Chu et al., 2015] | 4 |
Norming of Stimuli
Pleasant and unpleasant CWs were matched for emotional arousal, concreteness, log word frequency, orthographic length (number of letters), orthographic neighborhood frequency, and orthographic neighborhood size. Due to the volume of stimuli (approximately 2,000 unique vignettes), naturalness and predictability were assessed informally by the Tufts team. A vignette was approved only if three trained stimulus writers and at least one external reviewer reached consensus on its inclusion.
Counterbalancing and Randomization
Sixteen lists of stimuli were constructed using a modified Latin Square design. This design ensured that (a) each list included exactly one SR version and one NSR version from each scenario; (b) each version of a scenario appeared in exactly two lists; and (c) within each list, half of the NSR probes shared the same CW as their corresponding SR version, while the other half used the opposite CW. This structure allowed for systematic counterbalancing of both CW valence and contextual expectancy across participants. Each participant saw one list only. Within each list, SR and NSR vignettes were presented in separate blocks (SR first), with each type divided into four blocks of 40 trials. The order of trials within blocks was pseudo-randomized such that no condition appeared more than twice in a row.
Stimulus Presentation and Response Collection
Participants were seated in a quiet room and fitted with a multimodal sensor suite. To ensure signal quality, they were instructed to sit with both feet flat on the floor (legs uncrossed), rest their arms on the table with the left hand palm-down, and minimize movement during calibration and experimental blocks. During data collection their chin was rested on a chinrest in front of the camera. Limited movement was acceptable during breaks. As part of the recruitment and consent process, participants were advised to wear comfortable, loose-fitting clothing during the data collection session to facilitate sensor placement. At the data collection session, they also had the option to change into surgical gowns (provided by the study team) if their clothing was unsuitable.
Each session began with a resting-state baseline (Emory only), followed by the experimental blocks. Stimulus presentation and synchronization were controlled using PsychoPy, through which participants completed a computer-based task involving belief-relevant vignettes designed to probe implicit mental health constructs such as mood, agency, and suicidality. Each vignette consisted of three to four sentences. The broader context was presented in paragraph form, and the final sentence was delivered word-by-word using Rapid Serial Visual Presentation (RSVP). This approach enabled precise time-locking of neural and physiological responses to the final CW, which either confirmed or violated the reader’s expectations. Presentation of each trial followed a structured sequence:
- Start signal (“Ready?”; self-paced)
- Presentation of the broader context (paragraph form; self-paced between a minimum of 1.5 to a maximum of 50 seconds)
- Fixation cross (300 ms)
- Word-by-word presentation of the final sentence, excluding the CW (each word presented for 350 ms, interleaved with 150-ms blank screens)
- Presentation of the CW (700 ms)
- Blank screen (800 ms)
- Fixation cross (300 ms)
- For one-third of trials: comprehension question (self-paced between a minimum of 1 to a maximum of 50 seconds)
- Fixation cross (300 ms)
To monitor task engagement, participants responded to periodic yes/no comprehension questions using a three-button keypad labeled YES, GO, and NO. The physical layout of the buttons was randomized between two configurations (“YES-GO-NO" or “NO-GO-YES") and assigned per participant. A diagram of the assigned button layout was displayed below the monitor to allow reference without disrupting eye-tracking. All responses were made with the right hand, while the left hand remained available for physiological sensors.
Trials advanced either upon any button press (YES, NO, or GO) or automatically after a 50-second timeout. The specific durations listed above were selected so as not to align with screen refresh rates. Programmatic dithering of these presentation times (within milliseconds) in PsychoPy can further reduce the risk of synchrony with non-physiological sources and minimized habituation, helping to avoid EEG patterns such as steady-state visual potentials (SSVEPs), which may interfere with the N400 patterns.
Brief breaks were provided between blocks for rest and recalibration of sensors. At Emory and Georgia Tech, during recording, a privacy panel was placed between the participant and the study coordinator to minimize distraction and maintain privacy. Tufts used a separate room to host the participants and run the study. Coordinators monitored signal quality and system status from a dedicated workstation controlling the Biopac and EyeLink systems. This ensured precise stimulus synchronization, minimized participant burden, and supported high-quality data collection across all recorded modalities.
System Setup and Calibration
Before each session, all data acquisition systems—including BioSemi (for EEG collection), EyeLink (for eye tracking), and Biopac (used for collecting all physiological sensor data other than EEG and eye tracker)—were powered on and initialized. These systems remained active for the duration of the task and were shut down only after stimuli presentation concluded, ensuring complete capture of event-related synchronization markers across modalities.
The order in which sensors are connected to participants is flexible and may vary depending on the number of staff members available. In PRESCRIBE, the following sequence was generally found to be the most convenient and more practical: thoracic sensors (ECG, followed by SCG and RESP), the head cap (EEG), followed by— or, depending on staff availability, concurrently with—hand/arm sensors (EDA, BP, and finally PPG).
All components of the system were synchronized using hardware triggers to enable high-resolution alignment of neural, autonomic, and behavioral data with stimulus presentation events.
Electroencephalogram Data Acquisition Procedures
System Overview: EEG signals were recorded using the BioSemi ActiveTwo system, a high-resolution, battery-powered biopotential acquisition device. The system operates with a 24-bit ADC and supports sampling rates up to 16,384 Hz; recordings in this study used a sampling rate of 2048 Hz. The system’s battery-powered front-end and fiber-optic data transmission minimize electrical interference and eliminate ground loops, providing high-quality signals with low noise and minimal risk of electrical shock. All components were configured for DC coupling with full bandwidth and high input impedance.
Electrode Preparation and Placement: EEG data were acquired using a 32-channel BioSemi headcap, which is compatible with the international 10–20 system. Electrode placement was guided by head measurements from the nasion to the inion to locate the vertex (Cz) and ensure proper cap alignment. BioSemi records all electrodes referenced to the Common Mode Sense (CMS) active electrode. Therefore, Cz is not an electrical reference for other leads. Cap size was selected based on head circumference, with frontal electrodes positioned first to anchor the fit, and the cap was secured using a chin strap.In addition to the 32 scalp electrodes, four/five accessory electrodes (BioSemi EXG1-EXG5 channels) were used: one placed under each eye (at Tufts and Georgia Tech only under one eye), one to the side each eye, and one behind each ear on the left and right mastoids. These placements correspond to common ocular and mastoid referencing sites and are useful for detecting eye movement and saccade artifacts and providing potential offline re-referencing and denoising options.Electrode sockets on the cap were pre-filled with gel using a syringe to ensure good scalp contact and low impedance. Next, each electrode was inserted into its corresponding holder on the cap. Accessory electrodes were attached following skin preparation using alcohol and a mild abrasive (NuPrep) to further reduce impedance. Electrode cables were draped over the participant’s shoulder and connected to the BioSemi frontend machine located on a table behind the participant, to reduce motion artifacts and minimize mechanical strain. The CMS and Driven Right Leg (DRL) electrodes—unique to BioSemi’s amplifier system with dedicated cables—were connected to their designated ports. These electrodes replace the traditional ground electrode found in other EEG systems and form an active feedback loop that stabilizes the participant's Common Mode voltage with respect to the amplifier’s internal reference.In BioSemi's cap lead configuration the CMS electrode (active reference) and the DRL electrode (current return) are positioned on the left and right of Cz close to the center of the vertex. Although optimal placement typically involves placing the DRL away from the measurement region, the specific cap used in this study positioned it relatively close to the center due to spatial constraints. Proper signal quality was confirmed during setup via the “CMS in range” indicator light on the amplifier unit and impedance checks in the software. While EEG signals were recorded as voltages relative to CMS during acquisition, BioSemi’s ActiView software allows for optional reference selection for display purposes. However, only raw, unreferenced signals are saved in the resulting .BDF data files, enabling flexible re-referencing during offline analysis. BioSemi’s fully differential design ensures high common-mode rejection and robust signal quality, allowing residual noise (such as 50/60 Hz line interference) to be effectively removed through software-based re-referencing.
Figure 1: EEG cap and facial electrode placement
System Connection and Signal Monitoring: The 32-pin ribbon cable, 2-pin cable for CMS and DRL, and EXG leads were connected to the BioSemi A/D box. An optical fiber connected the A/D box to the data acquisition PC, minimizing signal susceptibility to noise. After physical connections were established, ActiView software was launched to monitor, verify connections and record EEG.
The correct configuration file was loaded in ActiView. Before starting the recording, the “Electrode Offset” tab was used to check signal quality; acceptable offsets were under ±50 mV. If high offsets were detected, additional gel was applied, and electrodes were adjusted. The “Monopolar Display” view was then used to monitor raw EEG signals in real time.
Once all electrodes showed stable signals, recording was initiated by selecting “Start File,” specifying the data file name and storage location. The software remained in recording mode until the end of the experimental session.
Best Practices: To ensure high-quality EEG recordings, the testing environment and preparation protocols were carefully controlled. Metal furniture and unnecessary electronic devices were removed from the EEG room to reduce electrical interference. After each session, electrodes were cleaned and stored in a dry, dark location, and headcaps were washed with mild soap and air-dried flat. Participants were asked to avoid caffeine and hair products on the day of their visit and to dress in layers to help regulate their body temperature during the session.
Regular system checks using one- and two-bucket tests were conducted to verify amplifier function. Troubleshooting followed BioSemi’s ActiveTwo user manual.
Eye Tracker Data Collection Procedures
System Overview: Pupil diameter and gaze data were collected using the EyeLink 1000 Plus system (SR Research), a high-speed, high-precision eye-tracking platform optimized for behavioral and psychophysiological research. The system operated in head-stabilized mode using the Desktop Mount configuration, with participants positioned using a chinrest for stability. Sampling was conducted binocularly at Emory, and monocularly (left eye only) at Georgia Tech, both at 1000 Hz. The EyeLink system uses infrared illumination (940 nm) to detect pupil and corneal reflection positions, enabling real-time tracking with spatial resolution down to 0.01° RMS and latency under 2.5 ms. The system is fully compatible with PsychoPy, which was used to coordinate stimulus presentation and event synchronization with EEG and other physiological recordings.
Hardware Setup and Calibration: Participants were seated in front of a monitor with their chin placed on a fixed chinrest (SR Research RP-HDR-CUPTC model, forehead rest removed for comfort at Georgia Tech). The eye tracker was manually adjusted to detect both pupils, and a nine-point calibration and validation routine (“HV9”) was performed prior to data collection. Calibration targets were presented at fixed screen positions, and participants were instructed to maintain steady fixation on each target. The system mapped pupil and corneal reflection coordinates to screen positions to determine gaze direction. Validation followed calibration to assess spatial accuracy, with tracking accepted only when the EyeLink software returned a “GOOD” or “FAIR” quality rating. The full calibration and validation procedure was repeated before each experimental block to maintain data quality.
Figure 2: Eye tracking camera between the monitor and the participant. Participants rest their chin on a chinrest and forehead stand. Forehead stand was not used at Georgia Tech.
Data Recording and Session Management: Once calibration was validated, gaze and pupil data collection was initiated within the TRACK module. Recording sessions were managed through EyeLink’s Host PC interface, and data were saved in EDF (EyeLink Data Format, a custom data format by EyeLink and unrelated to the more common European Data Format used in biosignal data collection). During each block, the system continuously streamed gaze coordinates and pupil diameter values synchronized with stimulus events via digital triggers. Drift correction routines were run as needed between vignette blocks, using brief fixation checks to detect misalignments between calibration and current gaze position. Corrections were applied only when the participant’s fixation behavior remained stable and within the trackable range.
Quality Assurance and Best Practices: Participants were instructed to minimize blinking and head movement during calibration and task blocks to avoid tracking loss. The chinrest setup helped stabilize the participant’s position throughout the session. A visual key for the response keypad was placed below the display to discourage head or eye movement away from the stimulus area. Practice sessions were conducted during setup to familiarize participants with the fixation task and ensure reliable performance.
Operators monitored signal quality in real time using EyeLink’s gaze trace and offset display. If tracking quality degraded or large validation errors appeared, adjustments were made to the camera position or lighting, and the calibration sequence was repeated. At the end of each session, data files were saved, and the system was powered down following SR Research’s recommended shutdown procedures.
Biopac Data Acquisition Procedures
System Overview: Physiological signals other than EEG and eye tracking were recorded using the Biopac MP160 Data Acquisition System. This modular platform supports simultaneous high-resolution recording of up to 16 analog channels and integrates multiple transducers through connected amplifiers and interface modules. All relevant Biopac modules were connected to the MP160 and managed via AcqKnowledge software on a dedicated data collection computer.
MP160 Core System: The MP160 system uses an Ethernet interface for local network connectivity, allowing remote access and control from any networked machine. The system supports aggregate sampling rates up to 400 kHz, ensuring high temporal precision for multimodal physiological data. Its modular design enables the use of interchangeable amplifiers and interface modules tailored to specific sensors.
HLT100C High-Level Transducer Interface: The HLT100C module provides the primary connection point for high-level output transducers, including accelerometers and force sensors. It supports up to 16 analog inputs and 2 analog outputs and supplies power directly to connected transducers. The Rev 2 version used in this study is compatible exclusively with the MP160 platform. The HLT100C interfaces with the MP160 via RJ11 connectors and allows simultaneous data acquisition across multiple channels, depending on configuration.
STP100D Isolated Digital Interface: The STP100D module manages digital inputs and outputs for the MP160 system. It provides 16 optically isolated digital input lines, 4 TTL outputs, and a dedicated external trigger input. Optical isolation up to 1500 VDC ensures electrical safety and signal integrity. The STP100D supports synchronization with third-party stimulus presentation software such as SuperLab and E-Prime, and can control external devices via solid-state relays.
Data Management with AcqKnowledge: All Biopac data were recorded using AcqKnowledge software, which provided real-time monitoring, visualization, and raw data storage. While AcqKnowledge supports a wide range of analysis features—including waveform segmentation, spectral analysis, and stimulus-response integration—its role in the PRESCRIBE project was limited to data acquisition. Physiological signals were stored in .acq format for offline processing using a custom biosignal analysis pipeline. AcqKnowledge was run concurrently with EEG and eye-tracking systems to ensure synchronized data collection across modalities.
Electrocardiogram (ECG) Data Acquisition Procedures
Sensor Placement: ECG signals were recorded using the BioNomadix wireless ECG amplifier connected to a standard three-lead electrode setup. Two adhesive electrodes were placed on the participant’s upper chest (left and right) representing left and right arms (LA and RA), and a third electrode was positioned on the lower left abdomen or hip (representing LL) to form a standard three-lead configuration. Electrode sites were cleaned with alcohol and lightly abraded as needed to ensure low impedance and high-quality signal acquisition.
System Integration and Signal Routing: The ECG signal was transmitted wirelessly to the Biopac MP160 system via the BioNomadix transmitter, which supports wireless transmission through separate, simultaneous communication channels. The routed channels for different wireless links are software-selectable in the AcqKnowledge software. Signal quality was verified in real time, and data were stored in .acq format for subsequent analysis using a custom biosignal processing pipeline.
Figure 3: ECG lead placement according to the three limb-lead system.
Respiration Data Acquisition Procedures
Sensor Placement: Respiratory activity was measured using the BioNomadix Respiration Transducer Belt, which was wrapped around the participant’s abdomen at the waist level. To ensure optimal belt positioning and signal quality, participants were instructed to take a deep breath and hold it while the belt was fastened. The belt was then secured with a hook-and-loop fastener to maintain a snug but non-restrictive fit, allowing the participant to breathe freely while ensuring consistent signal quality.
Figure 4: Respiration belt placement
System Integration and Signal Routing: The respiration signal was transmitted wirelessly from the BioNomadix belt to the Biopac MP160 system. Similar to the ECG, the wireless communication channel is software configurable via AcqKnowledge. Proper belt positioning and signal clarity were confirmed prior to recording. Data were stored in .acq format for offline analysis.
Photoplethysmogram (PPG) Data Acquisition Procedures
System Overview: Oxygen saturation (SpO₂) and pulse rate were measured using a Berry reusable SpO₂ sensor based on photoplethysmography. The sensor uses red light-emitting diodes (LEDs) and a photodetector to capture changes in blood volume associated with each heartbeat. These changes in light absorption are used to calculate SpO₂ levels and pulse rate in real time.
Sensor Placement: The PPG sensor was placed on the participant’s left ring finger. This placement allowed for continuous, non-invasive monitoring while minimizing interference with other sensor placements and the right hand button clicks. The sensor’s soft silicone construction ensured participant comfort during the entire recording session.
Figure 5: PPG sensor placement on the left-hand ring finger
System Integration and Signal Routing: The PPG sensor was connected to the Biopac PPG100C amplifier via a TCIPPG3 interface cable. The amplifier was configured through AcqKnowledge software with a gain setting of 10, a low-pass filter set to 10 Hz, and a high-pass filter set to DC. The signal was transmitted to the MP160 system and recorded synchronously with other physiological data. Data were stored in .acq format for later analysis.
Continuous Blood Pressure Data Acquisition Procedures
System Overview: Continuous, non-invasive blood pressure (BP) was recorded using the CNAP‱ Monitor 500. This system uses the Vascular Unloading Technique to provide beat-to-beat arterial pressure measurements from the finger. It combines a dual finger cuff (only one inflated at a time) with an upper arm cuff for calibration, enabling real-time tracking of systolic, diastolic, and mean arterial pressure comparable to invasive measurements.
The CNAP monitor applies the VERIFI algorithm [Fortin 2006] to correct for motion artifacts and noise, ensuring accurate waveform output. A built-in calibration routine aligns continuous BP readings with traditional cuff-based measurements. The system also provides a Perfusion Index for evaluating signal quality and features a BP Wave Out port for exporting the blood pressure waveform to external systems.
Sensor Placement and Setup: A dual finger cuff was placed on the participant’s index and middle fingers of the left hand. Cuff size was selected based on manufacturer guidelines to ensure proper fit above the knuckles. An upper arm cuff was secured around the participant’s right arm for periodic calibration. Once connected, the system was powered on, and calibration was initiated through options on the CNAP display. Calibration took approximately two minutes and was repeated after every two experimental blocks. These regular and scheduled calibrations (1) prevented automatic calibration from occurring during an experimental block and (2) allowed switching between fingers, reducing the risk of discomfort or excessive blood flow restriction to a single finger.
Figure 6: The CNAP 500 Monitor continuous blood pressure arm and finger cuff positions
System Integration and Signal Routing: The CNAP system was connected to the Biopac MP160 via a DA100C amplifier module using the BP Wave Out port. In AcqKnowledge, the DA100C module was configured with a gain of 1000, high-pass filter set to DC, and low-pass filter set to 300 Hz. The 10 Hz low-pass switch was disabled. This setup enabled continuous blood pressure signals to be digitized and recorded in sync with other physiological data streams.
Electrodermal Activity (EDA) Data Acquisition Procedures
System Overview: EDA, including skin conductance level and skin conductance response was recorded using the BIOPAC EDA100C amplifier. This module operates using a constant voltage method to capture sympathetic nervous system responses, particularly related to arousal and emotional processing.
Sensor Placement and Setup: EDA electrodes (Biopac EL507A) were affixed to the participant’s left palm using isotonic GEL101A electrode gel, ensuring good skin contact and low impedance. Two electrodes were placed—one on the thenar eminence (the muscle below the thumb) and one on the hypothenar eminence (the muscle below the pinky finger). The electrode leads (Biopac LEAD110A) were connected to a wireless BioNomadix transmitter, which transmitted data to the BIOPAC PPGED-R module and ultimately to the MP160 system. The left hand was selected for EDA recording, as the right hand was reserved for keypad responses during the task.
Figure 7: EDA sensor placement on the palm of the left hand
System Integration and Configuration: The EDA signal was transmitted through the PPGED-R module and routed to the MP160 system based on channel selection keys on the module and software. The module settings in AcqKnowledge were configured to enable real-time monitoring and storage of raw EDA data. Although AcqKnowledge provides analysis features such as event scoring and response identification, EDA data was exported and processed offline using a custom biosignal analysis pipeline.
Pre-recording Procedures: Prior to data collection, GEL101A gel was applied to the contact sites, and a short waiting period (approximately five minutes) was observed to allow for absorption and signal stabilization. This step improved consistency and minimized artifacts due to skin-electrode impedance changes. EDA data were collected continuously throughout the task and time-synchronized with other physiological signals through MP160 to enable integrated multimodal analysis.
Seismocardiogram (SCG) Data Acquisition Procedures
System Overview: SCG data, which capture the mechanical vibrations of the heart through the chest wall, were recorded using a high-sensitivity triaxial accelerometer (Model 356A32, PCB Piezotronics). This miniaturized sensor weighs 5 grams and has a sensitivity of 100 mV/g, allowing for accurate detection of low-amplitude cardiac-induced chest wall movements. The device operates across a frequency range of 1 Hz to 4 kHz and is enclosed in a hermetically sealed titanium case, providing durability and resistance to environmental interference.
Sensor Placement and Setup: The accelerometer was placed directly on the participant’s sternum, approximately three fingers below the suprasternal notch. Consistent orientation was maintained, with the positive x-axis pointing toward the participant’s head, the positive y-axis pointing towards the right of the participant, and the positive z-axis pointing out of the participants chest (perpendicular to chest). The sensor was secured using both horizontal and vertical strips of clinical tape, ensuring stability and alignment against the chest. To reduce motion artifacts, the cable was gently routed under the participant’s shirt and fixed in place.
Figure 8: triaxial accelerometer SCG sensor direction (left). The actual position of the triaxial accelerometer SCG and other sensors on the chest.
Signal Conditioning and Integration: The accelerometer’s three axes (X, Y, Z) were connected to a PCB Model 482C15 signal conditioner, which provided power and conditioned the signals for digitization. Each axis was connected to one of the four available input channels on the conditioner, which then output signals to the Biopac MP160 system via the AMI100D/HLT100C interface module. The signal conditioning box had a jumper-selectable analog gain of 1, 10, and 100 (before analog to digital conversion). The gain was set to 100 to obtain the best dynamic range in the collected signals. The conditioner also includes status indicators to alert the operator to sensor disconnects or overloads.
Software Configuration: In AcqKnowledge, each of the three SCG axes was configured as a custom input channel. This allowed for independent monitoring and recording of the X, Y, and Z directional signals. All SCG data were collected in real time with a sampling frequency of 1kHz, and synchronized with other physiological modalities via Biopac MP160. Raw data files were exported for further analysis through a custom biosignal processing pipeline.
Computers and Interfaces
Three main computers were used to manage stimulus presentation, eye tracking, and physiological data collection (Figures 9 and 10). All systems were synchronized to ensure accurate alignment of behavioral, EEG, and other physiological data.
Figure 9: Data collection setting at Georgia Tech. From right to left: PsychoPy software machine/stimulus display, eye-tracking machine, data collection machine (connected to Biopac and BioSemi)
Figure 10: Schematic of the multimodal setup comprising three computers and data collection equipment
Participant Interface Computer: This computer ran the PsychoPy experiment script and presented stimuli to participants. This computer also sent event synchronization triggers (‘ecodes’) to the other systems using a parallel port, marking stimulus onset and participant responses for synchronized data recording. The software was run in a Python 3.8 virtual environment. The required Python packages were installed using dependency files (‘requirements.txt’), and the pylink module for EyeLink was installed manually. The experiment was launched through the command line.
EyeLink Host Computer: This computer ran the EyeLink 1000 Plus eye tracker software, which recorded pupil size and gaze position. The system saved eye-tracking data in .EDF format. EyeLink received synchronization triggers from the stimulus computer to mark key events in the recording. Calibration quality was confirmed using the system’s built-in validation tool.
Physiological Recording Computer: This system managed data collection from the BioSemi EEG system and the Biopac physiological sensors (ECG, respiration, PPG, EDA, SCG, and blood pressure). It simultaneously ran ActiView for EEG acquisition and AcqKnowledge for the non-EEG physiological signals. The computer received synchronization triggers from the stimulus computer through the STP100D module (Biopac) and the USB2 optical receiver (BioSemi). Recordings began before the start of the PsychoPy session and continued until after it ended to ensure complete data coverage.
Data Synchronization and Setup: Synchronization across all systems was handled via parallel and serial port triggers. All devices recorded these triggers to align data streams during post-processing. EEG data were stored in .BDF format; physiological data were stored in .ACQ format. All systems operated on isolated networks, with local data storage and backup after each session. The eye-tracking system was connected from the PsychoPy-running computer (placed in front of the participant and presenting the psycholinguistic stimuli) through the Desktop Mount setting to a dedicated PC via an Ethernet cable.
Data Analysis Computers: All data analysis was performed offline after the data had been collected. Researchers at Georgia Tech and Charles River used personal or institutional computers running either Windows or macOS. At Emory, the data was processed using the high-performance computing cluster in the Department of Biomedical Informatics powered by Linux.
Although the high-performance computing cluster at Emory made it easier to handle large files and run tasks in parallel, the data analysis could also be performed on a modern personal computer. A system with 16 to 32 gigabytes of RAM, a solid-state drive (SSD), and a recent multi-core processor—such as an Intel Core i7 or Apple Silicon (M1 to M4)—was generally sufficient for most preprocessing and preliminary model development. More complex analyses, including deep learning models or high-resolution visualizations, could benefit from dedicated GPUs and additional computational resources, but these were not required for the majority of the analysis tasks reported in our primary published research.
Event Code System for Synchronization of Stimulus Presentation and Physiological Data Collection
During the experiment, every visual screen update that a participant sees was synchronized with a set of three digital event codes (“ecodes”) sent via parallel port to connect physiological recording systems (Biopac, Biosemi and eye tracking system). These ecodes, which are sent as digital bytes (8 bits) lasting 5ms, ensure precise timing between experimental events and physiological responses, as required for extracting event related potentials and other phase-synchronous physiological responses of the subjects. Each screen update (including phrases, questions and characters that appear on the computer running PsychoPy) triggers a triplet of ecodes—ecode1, ecode2, and ecode3—sent in rapid succession at the moment the stimulus appears.
Ecode1: Identifies the type of screen update or the role of the displayed word:
- 220: Non-essential words (e.g., “Ready?”, fixation cross, blank between words)
- 217: Non-target word
- 241: Word immediately before the target; self-relevant (SR)
- 242: Word before target; non-self-relevant (NSR) and expected
- 243: Word before target; non-self-relevant and unexpected
- 244: Word before target; practice trial
- 218: Context paragraph screen (full block of text)
- 219: Comprehension question
- 201–216: Experimental condition codes (for content-word trials only; see condition mapping)
Ecode2: Carries trial-level metadata:
- 220: Non-essential screen updates
- 219: Comprehension question
- 1 through 160: Unique scenario ID (each number corresponds to a specific vignette)
- 200: Practice condition (used instead of 201–216 for practice trials)
- 254: Marks the beginning of a list file; auto-triggers EEG recording. For the first trial of each block, ecode2 = 254 and ecode3 = 245
Ecode3: Indicates the word’s position in the sentence or structural markers:
- 220: Non-essential screens and context paragraph
- 219: Comprehension question
- 221–240: Word position in the sentence (e.g., 221 = 1st word, 222 = 2nd word, up to 240 = 20th word)
- 245: Boundary code that marks the start of a list file (sent with ecode2 = 254)
Each screen update (e.g., word presentation, question, or paragraph) is marked by this ecode triplet, allowing each event to be uniquely identified and time-locked across the behavioral and physiological data streams.
For consistency, all physiological data were referenced to the rising edge of the ecodes received over the parallel port. Considering that the Biopac, Biosemi, and eye-tracking systems operate and sample their data asynchronously with different sampling frequencies, software scripts were developed to identify the event times, enabling us to align physiologically synchronous events across modalities. For example, as part of our data analysis, using these event synchronization techniques, we have explored variabilities in EEG-based ERP responses to vignette stimuli during the systolic and diastolic phases of the cardiac cycle, acquired through the ECG and SCG modalities. Using this technique, data segments corresponding to each vignette can be extracted from all data modalities.
Data Backup and Upload
Data were backed up immediately after each session. All raw signals, behavioral data, and survey responses were first saved to encrypted local drives. Within 24 hours, files were transferred to HIPAA-compliant cloud servers maintained at each site—Georgia Tech, Emory, and Tufts. Data were then shared with Charles River and partner teams via institutional OneDrive and Box folders.
File names and folder structures were standardized to keep the data organized and easy to track. Access to the shared drive was restricted to approved team members.
All data were de-identified before uploading, with participant information stored separately using coded IDs. At each site, only IRB-approved team members had access to identifiable participant information and Protected Health Information (PHI) of clinical participants. Data shared across sites were fully de-identified. Upload activity was logged, and teams used version control to track changes and maintain data integrity.
Data Quality Check
Ensuring high-quality physiological signal acquisition is essential for the validity and reproducibility of multimodal neurophysiological studies like PRESCRIBE. The complexity and density of the sensor array used in this protocol necessitate rigorous pre-, intra-, and post-session quality assurance measures across EEG, ECG, PPG, respiration, EDA, SCG, and BP and eye tracking systems. We briefly outline best practices and automated procedures employed for verifying data integrity and minimizing artifacts.
Hardware Verification: Prior to each session, all hardware components—including the BioSemi ActiveTwo EEG system, Biopac modules, CNAP blood pressure monitor, and EyeLink 1000 Plus eye tracker—were inspected for functionality. This included verifying power supplies, cable integrity, wireless module pairing, and correct signal routing via the AcqKnowledge and ActiView software platforms.
Electrode and Sensor Integrity: EEG electrodes were visually inspected for wear and cleaned with warm water after each use. A scalp-electrode impedance test was performed using the Electrode Offset tab in ActiView to ensure all electrodes are below ±50 mV. ECG and EDA electrodes were disposable. For EDA, sensors were prepped with appropriate gels and checked for continuity and responsiveness using signal preview modes in AcqKnowledge.
Synchronization Readiness: A dry run of the PsychoPy script was conducted to ensure that event triggers (‘ecodes’) were being correctly received by the EEG, Biopac, and eye tracker through the STP100D isolated digital interface. This ensured accurate temporal alignment between stimuli presentation and physiological responses.
Real-time Visualization: All data streams were monitored in real time via ActiView (for EEG), AcqKnowledge (for Biopac-acquired modalities) and EyeLink Host Software (for eye tracking). Operators were trained to continuously observe for flatlines, saturation, excessive baseline drift, or spiking artifacts. In the event of signal dropout or unusual patterns, data acquisition was paused, faculty supervisors were contacted for guidance, and sensors were adjusted before resuming.
EEG Electrode Offset Tracking: The Electrode Offset tab in ActiView was referenced periodically throughout the session. Active electrodes with high or unstable offsets (>100 mV) were re-gelled or adjusted. Particular attention was paid to CMS/DRL connections, which are critical for EEG signal quality.
Motion Artifact Management: SCG and PPG signals were monitored for motion-induced artifacts, particularly during participant movement or breath-holding. If drift or signal dropout was detected, prompts were issued to the participant, or breaks were introduced.
Pupil Calibration Drift: Each block of visual stimuli was preceded by a 9-point calibration and validation routine using the EyeLink 1000 Plus system. Drift correction procedures were initiated mid-block if gaze deviation exceeds 1.0°, as determined by real-time feedback from the EyeLink Host PC.
Post-session File Integrity Checks: Upon session completion, all raw files (.BDF for EEG, .ACQ for Biopac, .EDF for EyeLink) were verified for completeness and consistency in metadata (e.g., channel count, sample rate, recording duration). File corruption was assessed via checksum comparison and header inspection scripts. MD5 checksums were calculated and compared for data uploaded and exchanged on the cloud to ensure data integrity during data transfer.
In addition, the Emory team developed a semi-automatic data preprocessing and visualization pipeline to support internal review and quality assurance. This pipeline handled the end-to-end processing of raw data: it aligned the different modalities and vignette and session events, applied standardized preprocessing steps, and extracted key physiological features across modalities. The extracted features were saved in a consistent format and automatically committed to a dedicated GitHub repository. The repository was configured to serve as a visual dashboard using GitHub Pages. GitHub Actions was configured to automate the build and deployment process. Each time new data or features were added, the dashboard was updated with minimal manual intervention. The result was a browsable, subject-level interface where summaries of the collected data and extracted features could be reviewed and demonstrated. This procedure provides a reproducible and scalable way to audit the quality of data collection and verify the outputs of the processing pipeline.
Software Requirements and Considerations
The software used for this protocol was developed using both MATLAB and Python 3 environments. During development, MATLAB was used alongside Python for prototyping and exploring signal processing algorithms, including ECG and EEG analysis using the OSET toolbox, and pyPPG for PPG analysis. The production system, implemented and deployed by Charles River, was developed entirely in Python. It handled all data processing, synchronization, and analysis using Python-based tools, including the MNE library for EEG data.
All Python code was run in isolated virtual environments, with dependencies installed from a version-controlled requirements file to ensure consistency across systems. MATLAB scripts used during development were also maintained under version control for traceability. All software, including Python scripts, configuration files, and supporting MATLAB functions, was tracked using Git. This ensured full reproducibility and collaborative development across teams.
The final system was modular, cross-platform, and capable of processing large-scale, multi-channel recordings efficiently. Intermediate and final outputs were stored in standard formats for integration and analysis.
Timing
We logged the timing of conducting the protocol at Georgia Tech and Emory. Due to subtle differences in session procedures, there are differences between the timing of the sites, which we report below.
Georgia Tech Timing: Each session took between 3.7 and 4.1 hours, depending on whether one or more researchers were present and how long each participant took for certain steps. With two or more researchers, sessions typically lasted 3.68 hours including cleanup. For sessions run by one researcher, the duration increased to about 4.07 hours.
The session began with a brief welcome, followed by the consent process, a background questionnaire, and a quick eligibility review. Participants were then offered a bathroom break. While optional, this break was strongly encouraged before sensor application.
Next, participants received instructions for the EEG task. Sensor setup followed and included the application of ECG, SCG, and a respiration belt. EEG setup involved prepping gel syringes and external electrodes, taking head measurements, placing the EEG cap, applying gel, and placing electrodes. EDA, BP, and PPG sensors were applied after or alongside EEG electrode placement. With two researchers, multiple steps could happen in parallel, which helped keep this part of the protocol efficient.
After all sensors were applied, calibration and quality checks were completed. BP setup and calibration took nearly five minutes total, during which EEG and cardiac signals were also checked and adjusted. These steps could be done simultaneously regardless of the number of researchers.
Once calibration was done, participants were shown examples of what not to do during the experiment (e.g., fidgeting or talking). The eye tracker was launched and adjusted, followed by a calibration and quality check. The initial calibration allowed extra time for retakes, which were often needed during participants’ first attempts.
The experimental portion included four SR blocks and four NSR blocks, each preceded by a practice block. SR blocks averaged 12.75 minutes, and NSR blocks averaged 10.5 minutes. Between blocks, participants took short, self-paced breaks that typically became shorter later in the session. Eye tracking was recalibrated multiple times, especially early in the session when miscalibrations were more likely. BP finger sensors were also repositioned and recalibrated several times for participant comfort. Altogether, the experimental phase—covering task blocks, practice, breaks, and recalibrations—took about two hours, with timing varying based on participant pace.
After completing the task, participants filled out paper-based mental health and post-task surveys, including the BDI, STAI, PHQ-9, PSS-14, PCL-5, SUDS, VAS, and a stimuli questionnaire. These surveys took about 17 minutes to complete. During this time, one researcher remained in the room, scanning the forms for missing responses while the participant completed the compensation paperwork. This final step—including review and a short goodbye—took about 2.5 to 3.5 minutes.
Once surveys were complete, researchers saved EEG and cardiac data. EEG data saving took about 10 seconds. Cardiac signals were saved in two formats, which took about 1.75 minutes total. Sensors were then removed in the following order: EEG, PPG, BP, EDA, respiration belt, ECG, and SCG. This entire removal process took about 6.5 minutes. Participants were also offered time to clean the EEG gel from their hair and use the bathroom again, which added about five minutes for those who chose to do so.
Cleanup of equipment began during the survey phase. One researcher stayed with the participant to clean all sensors except EEG. If a second researcher was available, they cleaned the EEG system at the same time. EEG cleanup took around 15 minutes, while cleaning the rest of the sensors and the eye tracker setup took under one minute.
Session timing varied slightly across participants. NSR blocks tended to go faster than SR blocks, and some participants required more recalibrations or longer breaks. On average, SR blocks took 2.25 minutes longer than NSR blocks. Break durations were also highly variable and often shortened toward the end of the session. Across participants, SR block timing showed about two minutes of standard deviation, and NSR blocks about 1.5 minutes. Breaks showed a standard deviation of roughly 1.5 minutes. These differences were mostly due to variation in sentence length, participant reading speed, and individual preferences for rest.
Emory Timing: The Emory protocol followed a similar overall structure to the Georgia Tech protocol, with most in-person steps remaining consistent. However, a key difference was that many of the questionnaires and screening procedures were completed remotely prior to the data collection session. Specifically, participants completed an initial screening via Zoom that included the MINI structured interview and short mental health measures, followed by additional self-report questionnaires administered via Qualtrics. These remote screening sessions averaged approximately 56 minutes across participants.
As a result of completing these steps beforehand, the in-person sessions at Emory were shorter. Once participants arrived onsite, the session began with a brief check-in and verbal re-confirmation of consent. The experimental setup then proceeded similarly to Georgia Tech: participants were given instructions for the EEG task, followed by sensor application, calibration, and adjustments. The same sensors were used (ECG, SCG, respiration belt, EEG, EDA, BP, and PPG), and multiple researchers often worked in parallel to streamline setup.
The experiment itself—comprising four SR and four NSR blocks, each preceded by practice, and interleaved with self-paced breaks—was identical in structure and duration to the Georgia Tech sessions. Eye tracker recalibrations and BP finger sensor adjustments were also conducted as needed throughout the task. In total, the experimental portion took approximately two hours, with variations depending on participant pacing, as observed at Georgia Tech.
At Emory, between blocks 4 and 5 (midway through the session), a very short user comfort questionnaire was administered by staff members, who took note of participants’ reported levels of comfort/discomfort regarding the sensors and vignettes.
After the final task block, only a brief post-task questionnaire and compensation process remained, since mental health surveys had already been completed remotely. EEG and cardiac data were saved, and all sensors were removed in the same order as the Georgia Tech sessions. Participants were offered time to clean the EEG gel.
Cleanup procedures mirrored those used at other sites: one researcher remained with the participant during final steps, while another cleaned equipment in parallel. Total in-person time at Emory was reduced by roughly 30 minutes compared to Georgia Tech, due to the offloaded remote screening and survey process. To note, Emory’s protocol included more detailed psychiatric assessments including the MINI. All other aspects of timing, task pacing, and setup procedures remained consistent across sites.
Troubleshooting
Data Integrity in Asynchronous Analog/Digital Transmission Systems
Physiological signals are typically low amplitude and analog in nature, making them vulnerable to noise and signal degradation during transmission. Sources of distortion include electromagnetic interference, powerline interferences, and analog/digital circuitry specifications, all of which can alter signal shape and timing. To mitigate these effects, it is critical to digitize analog signals as close to the acquisition site as possible. Both the BioSemi and Biopac systems follow this principle: BioSemi digitizes signals at the electrode level using battery-powered amplifiers and fiber-optic transmission, while Biopac digitizes signals through shielded and modular amplifier systems. This architecture improves signal fidelity by limiting analog noise exposure before sampling.
In our setup, we further minimized noise by using short, low-impedance shielded cables with standardized connectors. Cables were routed to avoid proximity to power sources and were kept free of long loops that could act as antennas. Equipment was connected through shared power outlets when possible to avoid so-called ‘ground loops,’ which are susceptible to inductive environmental noises. These practices helped preserve the quality of both analog and digital signals throughout acquisition.
BioSemi’s battery operation and optical signal transmission make it highly resistant to electromagnetic interference. Biopac sensors transmit data using coaxial cables, Ethernet, and Wi-Fi connections, which were configured to minimize crosstalk and interference.
Digital signals—such as TTL (0–5 V), LV-TTL (0–2.5 V), and CMOS (0–3.3 V)—are generally robust against environmental noise, particularly over short distances with proper cabling. These signals are designed with clear voltage thresholds, so small voltage fluctuations typically do not affect signal interpretation.
However, inevitable issues can arise when digital data is transmitted asynchronously between systems that do not share a common clock—such as between PsychoPy (stimulus software) and Biopac/BioSemi (recording systems). In such setups, there is no guarantee that the sampling of digital data by the receiver will occur during stable signal periods. If sampling occurs during a transition between bit states, it can lead to metastability and incorrect data interpretation.
This effect was observed in our system across nearly all sessions, where one or more bits of the 8-bit event code were misread due to sampling during bit transitions. For example, an event intended to be read as the code 223 (binary 11011111) was occasionally misinterpreted as 95 (binary 01011111) due to a timing mismatch at the most significant bit (MSB). Specifically, in all three sites, ‘ecode2’ values 132–135 were sometimes recorded incorrectly as 131–134, which required post-processing.
To mitigate this, we implemented a minimum dwell time requirement—a standard practice in digital communication. This approach sets a threshold duration that a bit value must remain stable before it is accepted as valid. Transient changes or noise-induced glitches below this threshold were discarded. This filtering reduces the likelihood of misinterpreting spurious transitions and improves the reliability of event code interpretation across systems. All event timings were corrected using this technique prior to analysis.
Alignment of Transcript Event Times with Biopac and BioSemi Systems
Due to the asynchronous nature of communication between the stimulus delivery system (PsychoPy) and the physiological data acquisition systems (Biopac and BioSemi), occasional discrepancies arise between the recorded event markers and the original stimulus events. These discrepancies occur even after implementing measures like enforcing minimum event durations to mitigate timing errors, detailed above. Over long recording sessions, bit-level transition errors can still result in missing, misread, or duplicated event codes in the physiological data.
Additional misalignments may be introduced by limitations in the operating system responsible for sending stimulus events. If digital output commands are sent too closely together or at inconsistent intervals, the receiving systems may fail to register some events or interpret them incorrectly.
To address these issues, a post hoc alignment procedure was developed to synchronize the event logs from Biopac and BioSemi with the ground-truth transcript of stimulus events. This procedure compares the sequence of events across systems and adjusts mismatches using a combination of strategies:
- Replacement: When an event code in the physiological data deviates from the transcript by a single bit—likely due to sampling during a voltage transition—the code is corrected by substituting it with the corresponding transcript value.
- Omission: Extra events found in the Biopac or BioSemi logs that do not have a matching event in the transcript are identified and removed. These are typically caused by transient noise or unstable bit transitions.
- Insertion: If an expected event is recorded in the transcript but missing from the physiological logs, the missing event is inserted into the aligned data to maintain sequence integrity. Since the exact timing of the missing event is not known in the Biopac or BioSemi time frame, a placeholder is inserted with a missing timestamp.
Each transcript event is compared to the physiological event logs within a small temporal window, and the alignment procedure selects the correction that results in the most consistent sequence across all systems. The outcome is a synchronized dataset in which each event in the transcript is matched to its corresponding representation in the Biopac and BioSemi data, even if one or more systems originally recorded the event incorrectly or missed it altogether.
The aligned output preserves the original time axes from each system, allowing for sample-level comparisons across EEG and physiological signals despite differences in sampling rates. This alignment step is essential for ensuring that all event-related analyses are grounded in accurately timed and consistently identified experimental events.
Poor EEG/ECG Signal Quality
Weak EEG or ECG signals often result from poor electrode contact, insufficient gel, or electrical interference. Apply enough gel to ensure good contact, but avoid excess to prevent bridging and capacitive effects between electrodes. Secure cables to reduce motion artifacts, and route EEG wires far from power lines to minimize interference. Baseline drift in EEG may occur due to capacitive buildup (resulting in EEG baseline wandering visible in the real-time acquisition software). This can be corrected by adjusting electrodes or reapplying gel. ECG quality also improves with proper skin prep using alcohol and mild abrasion.
Participants with thick or dense hair may require more care to part hair and ensure electrodes make good scalp contact. Bald areas can sometimes show higher impedance, leading to increased noise or weaker EEG signals. In both cases, check electrode offsets, clean skin, and reapply gel or minimally adjust placement as needed to maintain signal quality.
Synchronization Mismatch
Mismatches in timing between systems typically stem from loose, worn, or damaged cables resulting in missed trigger events. Check all interconnections from the stimulus PC to Biopac, BioSemi, and EyeLink. Review PsychoPy logs to confirm triggers were sent. Check the ‘ecodes’ received by Biopac and BioSemi. Troubleshoot from the PsychoPy software outward, verifying each subsystem receives triggers and data as expected.
Low SCG Amplitude
SCG signals are low in amplitude and require proper amplification. The default 0dB gain on the accelerometer signal conditioner is insufficient. Before data collection and participant admission, open the casing and change the jumper setting to 100x gain. During data collection, ensure the sensor is firmly taped to the sternum with minimal cable movement to reduce noise.
Participant Fatigue
Sessions run 2.5 to 3 hours, which may cause fatigue. This can be mitigated by self-paced breaks between blocks. No excess fatigue complaints were reported during PRESCRIBE, but if signs emerge, extend rest periods or shorten sessions as needed. Stop the session upon any emergency or excess fatigue.
Eye Tracker Drift or Tracking Issues
Eye tracker drift is managed by recalibrating before each block and correcting mid-session if needed. Tracking can fail for participants wearing glasses, contacts, or with prior LASIK surgery. In these cases, eye tracking is omitted, but other data are retained.
Anticipated Results
The PRESCRIBE protocol is designed to generate high-fidelity, time-synchronized multimodal physiological data for analyzing neurocognitive and affective responses to depression-relevant language. By linking structured linguistic stimuli with EEG, cardiovascular, electrodermal, respiratory, and ocular measures, the protocol is expected to reveal physiological patterns associated with depressive symptomatology. These results may inform the development of objective, non-invasive models for assessing mental health risk, offering a complementary approach to traditional self-report and clinical assessments. Anticipated results further include include:
- Reliable EEG event-related potentials (e.g., N400, LPP, LFP) that vary as a function of self-relevance and depressive symptom severity, particularly during processing of belief-consistent or belief-violating content.
- Autonomic markers (e.g., heart rate variability, electrodermal activity, respiration, blood pressure) that differentiate individuals with depression from controls and are impacted by emotional arousal and cognitive load.
- Eye-tracking metrics (e.g., fixation, pupil dilation) that reflect attentional engagement and may vary by symptom profile and stimulus valence.
- Synchronized event markers for multimodal studies enable precise alignment of simultaneously recorded physiological responses with behavioral and linguistic events, supporting robust time-locked analyses of physiological data in response to psycholinguistics stimuli.
- Depression score–labeled datasets (e.g., PHQ-9, BDI-II) suitable for downstream modeling, machine/deep-learning, and AI-powered decision-making.
Limitations
While the PRESCRIBE protocol offers a unique framework for multimodal psychophysiological data collection in mental health research, several limitations must be acknowledged. First, the protocol requires highly trained personnel for setup, calibration, and monitoring across EEG, eye tracking, and cardiovascular sensors. This expertise requirement limits feasibility for deployment in non-specialist or clinical environments. Second, despite efforts to standardize hardware synchronization and alignment across sites, the complexity of multi-system integration introduces susceptibility to signal dropout, hardware drift, and event code misalignment, which can require substantial post-processing correction. Third, the protocol is logistically intensive and requires controlled laboratory environments with low electromagnetic interference and stable lighting—conditions not always replicable in community or ambulatory settings. Many of the sensors used—particularly EEG, eye tracking, SCG, and continuous blood pressure monitoring—are not currently amenable to mobile or unsupervised use. As such, the protocol in its current form is optimized for research applications and may not translate directly to remote or real-world clinical settings without substantial modification.
Session durations of 2.5–3 hours may also lead to participant fatigue, which can impact signal quality, particularly in vulnerable psychiatric populations. Furthermore, although the stimuli were designed to be emotionally evocative yet tolerable, the use of depression- and suicidality-related content carries inherent risks of participant distress, necessitating rigorous ethical oversight and crisis management protocols. Finally, the current protocol is not yet validated across diverse linguistic, cultural, or age populations, which may limit the generalizability of the findings. Future adaptations should consider simplified versions with fewer sensors, mobile-compatible sensor suites, and tailoring of stimuli to non-native English speakers to enhance inclusivity and real-world applicability.
Compensation
This study was not intended to provide direct benefit to participants. At Georgia Tech and Emory, participants received an honorarium of up to $150 for their participation in the study. At Emory, they were paid $50 for the screening visit (Visit 1) and $100 for the biosignal monitoring session (Visit 2). At Georgia Tech, participants were awarded $150 for the single data collection session they attended, at the end of the session. We also covered parking costs for each clinical visit if needed. Participants were paid by mail after completing their visits or for any visits they completed if they withdrew early. At Emory, as an alternative, participants could choose to receive payments through the Greenphire ClinCard system. At Tufts, which involved fewer data collection modalities, participants were paid $17 per hour.
Ethics Statement
This study followed the ethical principles of the Declaration of Helsinki. It was approved by the Institutional Review Boards (IRBs) at Emory University (STUDY00006938), the Georgia Institute of Technology (H23151), and Tufts University (STUDY00003388), as well as by the Navy’s Human Research Protection Office (HRPO). Each institution’s IRB and HRPO also oversaw participant recruitment. All participants gave written informed consent before joining the study.
Competing Interests
Authors have no competing interests to declare.
Protocol references
(Alzate 2024) Alzate, M.; Torres, R.; De la Roca, J.; Quintero-Zea, A.; Hernandez, M. Machine Learning Framework for Classifying and Predicting Depressive Behavior Based on PPG and ECG Feature Extraction. Appl. Sci. 2024, 14, 8312. DOI: https://doi.org/10.3390/app14188312
(Baker 1998) Baker, R., & Dunbar, G. C. (1998). The Mini-International Neuropsychiatric Interview (MINI): The development and validation of a structured diagnostic psychiatric interview for DSM-IV and ICD-10. Journal of Clinical Psychiatry, 59(20), 22–33.
(Beck 1961) Beck, A. T. (1961). An Inventory for Measuring Depression. Archives of General Psychiatry, 4(6), 561. DOI: https://doi.org/10.1001/archpsyc.1961.01710120031004
(Beck 1996) Beck, A. T., Brown, G., & Steer, A. R. (1996). Beck Depression Inventory II manual. The Psychological Corporation. DOI: https://psycnet.apa.org/doi/10.1037/t00742-000
(Brennan 2001) Brennan, M., Palaniswami, M., & Kamen, P. (2001). Do existing measures of Poincare plot geometry reflect nonlinear features of heart rate variability? IEEE Transactions on Biomedical Engineering, 48(11), 1342–1347. DOI: https://doi.org/10.1109/10.959330
(Chu 2015) Chu, C., Klein, K. M., Buchman‐Schmitt, J. M., Hom, M. A., Hagan, C. R., & Joiner, T. E. (2015). Routinized Assessment of Suicide Risk in Clinical Practice: An Empirically Informed Update. Journal of Clinical Psychology, 71(12), 1186–1200. DOI: https://doi.org/10.1002/jclp.22210
(Cohen 1983) Cohen, S., Kamarck, T., & Mermelstein, R. (1983). A global measure of perceived stress. Journal of Health and Social Behavior, 24(4), 385–396. DOI: https://doi.org/10.2307/2136404
(Eysenck 1979) Eysenck, H. J. (1979). The Structure and Measurement of Intelligence. Springer Berlin. Heidelberg. DOI: https://doi.org/10.1007/978-3-642-67075-6
(Fortin 2006) Fortin, J., Marte, W., Grüllenberger, R., Hacker, A., Habenbacher, W., Heller, A., Wagner, CH., Wach, P., & Skrabal, F. (2006). Continuous non-invasive blood pressure monitoring using concentrically interlocking control loops. Computers in Biology and Medicine, 36(9), 941–957. https://doi.org/10.1016/j.compbiomed.2005.04.003
(Hosseinifard 2013) Hosseinifard B, Moradi MH, Rostami R. Classifying depression patients and normal subjects using machine learning techniques and nonlinear features from EEG signal. Comput Methods Programs Biomed. 2013 Mar;109(3):339-45. DOI: https://doi.org/10.1016/j.cmpb.2012.10.008. Epub 2012 Nov 1. PMID: 23122719.
(Hunt 2003) Hunt, M., Auriemma, J., & Cashaw, A. C. A. (2003). Self-Report Bias and Underreporting of Depression on the BDI-II. Journal of Personality Assessment, 80(1), 26–30. DOI: https://doi.org/10.1207/S15327752JPA8001_10
(Karimi 2025) Karimi, S., Nateghi, M., Cestero, G. I., Chitadze, L., Deepanshi, Yang, Y., Vyas, J. H., Chen, C., Bouzid, Z., Yaldiz, C. O., Harris, N., Bull, R., Stone, B. T., Lynn, S. K., Bracken, B. K., Inan, O. T., Bremner, J. D., & Sameni, R. (2025) [in press]. Prescreening depression using wearable electrocardiogram and photoplethysmogram data from a psycholinguistic experiment. Physiological Measurement.
(Kiang 2017) Kiang, M., Farzan, F., Blumberger, D. M., Kutas, M., McKinnon, M. C., Kansal, V., Rajji, T. K., & Daskalakis, Z. J. (2017). Abnormal self-schema in semantic memory in major depressive disorder: Evidence from event-related brain potentials. Biological psychology, 126, 41–47. DOI https://doi.org/10.1016/j.biopsycho.2017.04.003
(Kim 2018) Kim, A.Y., Jang, E.H., Kim, S. et al. Automatic detection of major depressive disorder using electrodermal activity. Sci Rep 8, 17030 (2018). DOI: https://doi.org/10.1038/s41598-018-35147-3
(Klumpp 2010) Klumpp, H., Keller, J., Miller, G. A., Casas, B. R., Best, J. L., & Deldin, P. J. (2010). Semantic processing of emotional words in depression and schizophrenia. International journal of psychophysiology : official journal of the International Organization of Psychophysiology, 75(2), 211–215. DOI: https://doi.org/10.1016/j.ijpsycho.2009.12.004
(Levis 2019) Levis, B., Benedetti, A., & Thombs, B. D. (2019). Accuracy of Patient Health Questionnaire-9 (PHQ-9) for screening to detect major depression: Individual participant data meta-analysis. Bmj, 365. DOI: https://www.bmj.com/content/365/bmj.l1476.abstract
(Potter 1984) Potter, M. C. (1984). Rapid serial visual presentation (RSVP): A method for studying language processing. New Methods in Reading Comprehension Research, 118, 91–118.
(Sameni 2025) Sameni, R. (2006-2025). The open-source electrophysiological toolbox (OSET), version 4.0. URL: https://github.com/alphanumericslab/OSET
(Sharpe 2025) Sharpe V, Vallampati A, Choi Perrachione A, Klein J, Wargo M, Bracken B, Lynn S, & Kuperberg GR. Beyond Self-Report: Direct Detection of Depressive Symptoms from Neural Activity. Poster presented at the 32nd Annual Meeting of the Cognitive Neuroscience Society. Boston, MA. March 29-April 1, 2025.
(Stone 2025) Stone, B. T., Desrochers, P. C., Nateghi, M., Chitadze, L., Yang, Y., Cestero, G. I., Bouzid, Z., Chen, C., Bull, R., Bremner, J. D., Inan, O. T., Sameni, R., Lynn, S. K., & Bracken, B. K. (2025). Decoding depression: Event related potential dynamics and predictive neural signatures of depression severity. Journal of Affective Disorders, 119893. DOI: https://doi.org/10.1016/j.jad.2025.119893
(Warriner 2013) Warriner, A. B., Kuperman, V., & Brysbaert, M. (2013). Norms of valence, arousal, and dominance for 13,915 English lemmas. Behavior Research Methods, 45(4), 1191–1207. DOI: https://doi.org/10.3758/s13428-012-0314-x
(Yang 2023) Yang, M., Cai, C., & Hu, B. (2023). Clustering Based on Eye Tracking Data for Depression Recognition. IEEE Transactions on Cognitive and Developmental Systems, 15(4), 1754–1764. DOI: https://doi.org/10.1109/tcds.2022.3223128