Aug 06, 2025
A DNA Amplicon Sequence Data Processing and Analysis Pipeline for Environmental Microbiomes
- Kathryn F. Atherton1,
- Michael Silverstein1,
- Chikae Tatsumi1,
- Corinne Vietorisz1,
- Jennifer M. Bhatnagar1
- 1Boston University


Protocol Citation: Kathryn F. Atherton, Michael Silverstein, Chikae Tatsumi, Corinne Vietorisz, Jennifer M. Bhatnagar 2025. A DNA Amplicon Sequence Data Processing and Analysis Pipeline for Environmental Microbiomes. protocols.io https://dx.doi.org/10.17504/protocols.io.n2bvje88xgk5/v1
License: This is an open access protocol distributed under the terms of the Creative Commons Attribution License, which permits unrestricted use, distribution, and reproduction in any medium, provided the original author and source are credited
Protocol status: Working
We use this protocol and it's working
Created: August 06, 2025
Last Modified: August 06, 2025
Protocol Integer ID: 224187
Keywords: amplicon sequencing, microbiome, quality control, Illumina, compositional data, batch correction, functional annotation, bioinformatics, contaminant removal, analysis pipeline for environmental microbiomes amplicon, environmental microbiomes amplicon, dna amplicon sequence data processing, reproducible protocol for amplicon sequence cleaning, amplicon sequence cleaning, microbial community, fungal community, tools for data cleaning, sequencing batch effect, variation in dna extraction method, pipeline for asv inference, data cleaning, sequencing platform, dna extraction method, analysis pipeline, robust downstream analysis
Abstract
Amplicon sequencing is a widely used method to characterize microbial communities across environmental and host-associated sample types. However, variation in DNA extraction methods, sequencing batch effects, contamination, and low-quality samples can introduce biases that hinder reproducibility and cross-sample comparisons. Here, we present a modular and reproducible protocol for amplicon sequence cleaning that accommodates diverse sample types and experimental designs. This workflow standardizes quality filtering, contaminant removal, batch correction, and functional annotation to enable robust downstream analyses of bacterial and fungal communities. The protocol integrates the BU16S-ITS pipeline for ASV inference with R-based tools for data cleaning and normalization and is suitable for projects using Illumina sequencing platforms. Code and documentation are available at https://github.com/k-atherton/Amplicon_Sequence_Data_Processing.


Guidelines
BACKGROUND
Amplicon sequencing of marker genes for microorganisms, such as genes coding the RNA component of the small subunit of the ribosome (16S rRNA genes) and the intergenic transcribed spacer DNA (ITS)
has become a foundation of microbial ecology, enabling high-throughput studies of bacterial and fungal community composition across a wide range of environments (Qin et al., 2021; Thompson et al., 2017; Vasar et al., 2022). Despite its popularity, amplicon sequencing data can be challenging to interpret due to technical variability introduced during sample collection, DNA extraction, amplification, and sequencing. These challenges are particularly acute in studies of the environmental microbiome, which can include many rare taxa (Sogin et al., 2006), as well as studies that include multiple sample types, sequencing batches, or preparation protocols, as such heterogeneity can obscure biological signals (Qin et al., 2021).
To address these issues, we developed a reproducible amplicon sequence quality control and data
processing workflow that integrates established, freely available bioinformatics and statistical tools to generate tables of microbial taxa and functional groups for downstream visualization and statistical analyses. Our approach was designed to clean, normalize, and annotate DNA sequences – or reads – generated via high-throughput sequencing of multiple types of PCR amplicons from whole microbial communities in multiple tree-associated microbiomes. However, the protocol can be used to combine datasets from different environmental microbiomes across habitats or with different DNA extraction and PCR amplification protocols. The protocol builds on the BU16S-ITS pipeline for amplicon sequence variant (ASV) calling and taxonomy assignment (Silverstein et al., 2024) and incorporates additional steps in R for: (a) filtering out samples that have low read numbers, (b) contaminant identification and removal, (c) correction for samples analyzed on different sequencing runs (i.e., batch correction), and (d) data transformations for comparisons of microbiomes across samples. We also provide methods for calculating popular microbial diversity metrics and assigning taxa to “functional guilds” that have different primary resources and/or ecological roles in a community, including pathogens and nutrient cyclers. By following this protocol, researchers can quality control and normalize amplicon datasets for improved interpretability and comparability across samples in microbial ecology, environmental health, and host-microbe interaction studies. The code for following this protocol can be found at https://github.com/k-atherton/Amplicon_Sequence_Data_Processing.
DNA SEQUENCE DATA
PCR amplification is conducted for two types of ribosomal DNA: the hypervariable region of the small subunit (16S V4) rRNA genes that are specific to bacteria (Caporaso et al., 2011) and the ITS2 DNA that is specific to fungi (Anthony et al., 2020). To generate sequence data for a single community, we multiplex both types of amplicons onto a sequencing run, as this tends to generate very high quality DNA sequence data for both amplicon types, potentially because the sequence differences and length differences between the ITS2 (average of 182 bp, R.-H. Yang et al., 2018) and 16S (~ 250-350 bp, Caporaso et al., 2023; Zhao et
al., 2023) help with successful initial cluster identification by the Illumina sequencing platform (Fadrosh et al., 2014).
In addition, we avoid sequencing different experimental treatments or environmental conditions on different sequencing runs, so that we can complete batch correction (correction of sequence data for variation by sequencing run) if needed. Sequencing samples from different conditions on the same sequencing run requires that we sequence replicates of a condition (e.g., urban interior forests) on different sequencing runs, so that all sequencing runs have samples representing each study condition. To accomplish this, we often multiplex replicates of different “sample types” (i.e. habitats, such as soil, roots, or leaves) that experienced different environmental conditions on the same sequencing run (Table 1). The quality control and data processing workflow below is optimized for this type of DNA sequence data, generated from multiple sample types and amplicon types sequenced across Illumina MiSeq runs, but can be applied to any type of DNA amplicon sequence data.
Materials
SOFTWARE AND DATA SETS
Software
- BU16S-ITS pipeline (Silverstein et al., 2024; https://github.com/Boston-University-Microbiome-Initiative/BU16s)
- R (R Core Team, 2013; version 4.3.1)
- compositions R package (Boogaart et al., 2024; version 2.0-8; http://www.stat.boogaart.de/compositions/)
- decontam R package (N. M. Davis et al., 2018; version 1.29; https://bioconductor.org/packages/devel/bioc/html/decontam.html)
- dplyr R package (Wickham et al., 2023; version 1.1.4; https://dplyr.tidyverse.org)
- ggplot2 R package (Wickham, Chang, et al., 2025; version 3.5.1; https://ggplot2.tidyverse.org/)
- gridExtra R package (Auguie & Antonov, 2017; version 2.3; https://CRAN.R-project.org/package=gridExtra)
- optparse R package (T. L. Davis et al., 2024; version 1.7.5; https://github.com/trevorld/r-optparse)
- phyloseq R package (McMurdie & Holmes, 2013; version 1.44.0; https://joey711.github.io/phyloseq/)
- purrr R package (Wickham, Henry, et al., 2025; version 1.0.4; https://purrr.tidyverse.org/)
- readr R package (Wickham, Hester, et al., 2024; version 2.1.4; https://readr.tidyverse.org/)
- readxl R package (Wickham, Bryan, et al., 2025; version 1.4.2; https://readxl.tidyverse.org/)
- robCompositions R package (Templ et al., 2023; version 2.4.1; https://github.com/matthias-da/robCompositions)
- sva R package (Leek et al., 2025; version 3.48.0; https://bioconductor.org/packages/sva)
- tidyr R package (Wickham, Vaughan, et al., 2024; version 1.3.1; https://tidyr.tidyverse.org/)
- tidyverse R package (Wickham & RStudio, 2023; version 2.0.0; https://www.tidyverse.org/)
- vegan R package (Oksanen et al., 2015; version 2.6-4; https://vegandevs.github.io/vegan/)
- vroom R package (Hester et al., 2023; version 1.6.3; https://vroom.r-lib.org)
Input Data
There are two main types of input data for this pipeline: sequence data files (1) and metadata files (2) that describe each samples (e.g., environmental conditions, sampling date and location, etc.) that has corresponding sequence data.
- The main input for this workflow consists of demultiplexed FASTQ files generated from paired (forward and reverse) short-read (up to 250 bp) high-throughput sequencing of PCR amplicons via Illumina sequencing platforms. The sequencing facility can often provide demultiplexed (i.e., sequence data separated by amplicon type and DNA barcode or sample ID) data back to the user, if the user provides the sequencing facility with DNA primer and barcode information for each sample. Each sequenced sample is represented by a pair of files: one for the forward reads and another for the reverse reads.
- The secondary input file for these samples is a metadata file for each amplicon sequence dataset. In the metadata, there should be a column called “sample_name” that matches the sample naming scheme from the demultiplexed FASTQ files. In addition, the file should contain a column called “is_control” with values TRUE (in rows for negative controls) or FALSE (in rows for samples), a column called “sample_type” which defines the sample type (e.g., soil, leaf, root), a column called “sequencing_batch” which defines the sequencing run the sample was included on, and a column called “dna_conc”, which contains the sample’s DNA concentration in ng/µL before sample pooling into a single library for sequencing (Table 1, attached file called "example_metadata.xlsx").
Operation
The pipeline is run on Boston University’s Shared Computing Cluster (BU SCC), a Linux cluster, using a command-line interface. For 16S and ITS amplicon sequence data from 854 samples, 22.9 Gb storage was needed for raw FASTQ files and up to 16 cores were used for parallel computation. The first component of the pipeline is loaded as a module on the cluster, then a sequence of commands is submitted as a batch job, so that it will run on another cluster computer that has multiple processors. The second component of the pipeline is also run on the cluster, but can be run locally on a personal computer as well. Each step of the pipeline is run separately for each amplicon dataset analyzed (i.e. 16S and ITS data are not combined for any step, even if sequence data from both amplicons was produced for the same samples).
Safety warnings
There are no warnings applicable to this protocol.
Before start
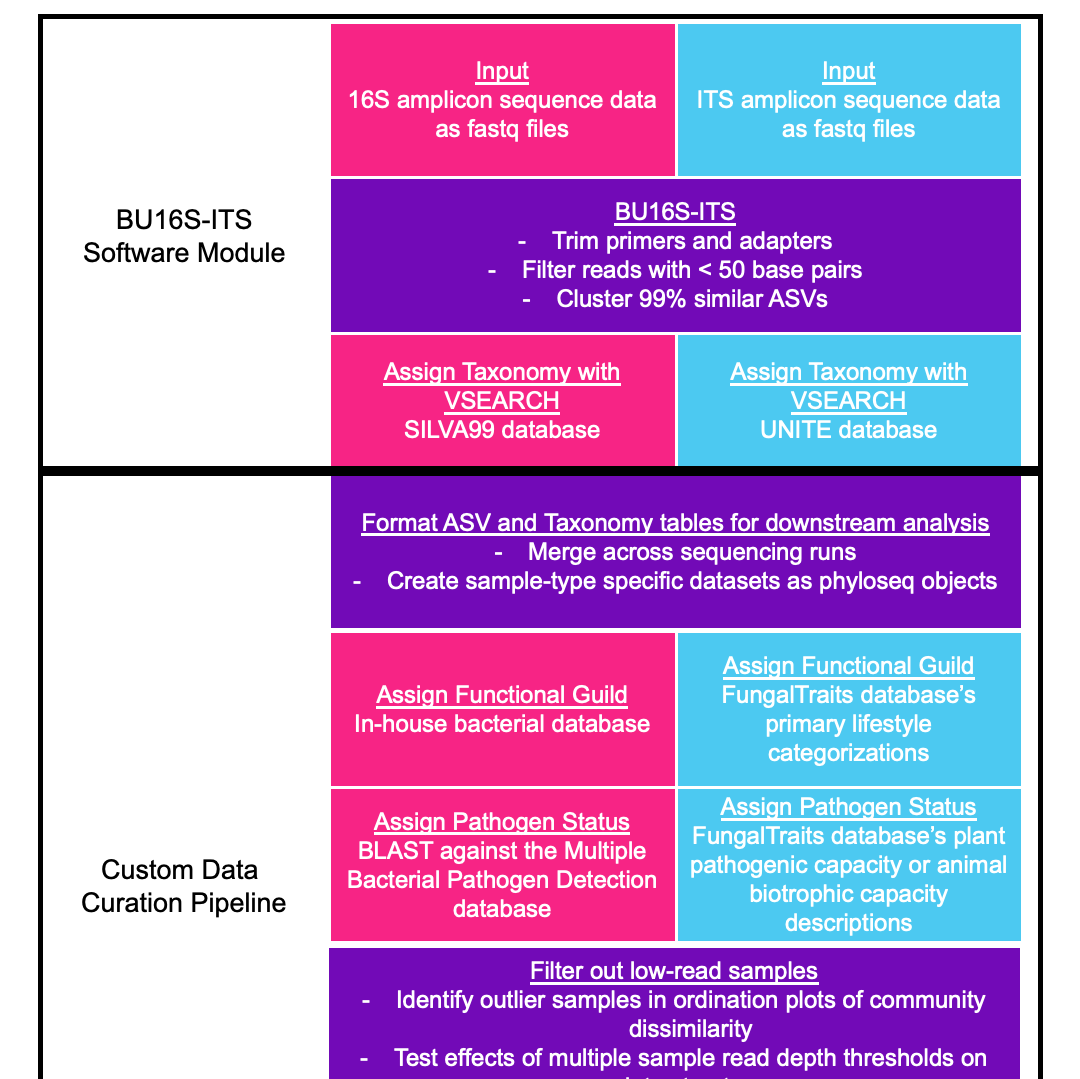
First, we implement a software module consisting of a set of standard, freely available software products (with default parameters) to isolate high-quality sequences from low-quality sequences and calculate counts of taxonomically annotated Amplicon Sequence Variants (ASVs) in each sample (Figure 1). This in-house pipeline module cleans, clusters, and annotates sequences by combining (a) primer and adapter trimming from sequences and removal of short, low-quality sequences, (b) clustering of sequences into ASVs, and (c) taxonomic assignment of ASVs by mapping to established public DNA sequence databases for bacteria and fungi. Then, we constructed a custom data curation pipeline to format ASV tables (containing untransformed ASV counts per sample) for additional data cleaning steps, remove poorly-sequenced samples, transform ASV counts so they are comparable (i.e. normalized) across samples, and calculated diversity (alpha- and beta-) and functional group relative abundances across samples (Figure 1). The resulting data tables (in .csv format) can be used for statistical analyses of microbial group (taxonomic or functional) relative abundances and diversity differences across samples or sample groups.
QUALITY FILTER RAW SEQUENCE DATA, IDENTIFY AMPLICON SEQUENCE VARIANTS, AND ASSIGN TAXONOMY
Raw amplicon sequencing data is processed using BU16S-ITS (Silverstein et al., 2024), a QIIME2 environment-based (Bolyen et al., 2019) pipeline, customized to run on the BU SCC. Briefly, BU16S-ITS first trims out primers from each sequence and filters out reads of less than 50 base pairs (which would provide unreliable taxonomic assignments and ASV construction (Liu et al., 2007)), using cutadapt (Martin, 2011), then identifies amplicon sequence variants (ASVs) that are 99% similar in rDNA sequence using DADA2 (Callahan et al., 2016). BU16S-ITS classifies a given ASV sequence to a reference database and assigns the taxonomy shared by the majority of the resulting hits. ASVs are assigned taxonomy if they have 95% or greater sequence identity to sequences from individual taxa in an online database: SILVA99 (Quast et al., 2013; version 138.1) for bacteria or UNITE dynamic database (Nilsson et al., 2019; version 9.0) for fungi, using VSEARCH (Rognes et al., 2016). This step is performed separately for each sequencing run. ASVs are assigned a hash, or encryption, of the sequences themselves, so that ASV identifiers are unique to a given sequence, but are the same across all runs.
FORMAT ASV AND TAXONOMY TABLES FOR DOWNSTREAM ANALYSIS
For analysis of microbial (alpha- and beta-) diversity and relative abundances of microbial (taxonomic or functional) groups across samples, we create sample type-specific datasets that can be cleaned and analyzed according to their unique properties (i.e., sequencing depth and diversity). First, the output ASV tables from the BU16S-ITS pipeline – which contain untransformed counts of each ASV in each sample – and the taxonomy tables – which contain the taxonomic classification information for each ASV – are combined across all sequencing runs into one dataset. This collects all replicate samples for a sample type into a single file. Because different sample types (e.g. soils vs. leaves) may have different sequencing depths or diversity levels, data from different sample types need to be cleaned and transformed separately to allow for optimal calculation of diversity and relative abundances of taxa. To accomplish this, the single data file is then separated by “sample type” for sample type-specific processing. Each sample type-specific dataset is converted into a phyloseq (McMurdie & Holmes, 2013) object for downstream processing.
To assign taxa to functional groups, fungal genera are matched to the FungalTraits database (Põlme et al., 2020) and assigned the corresponding Primary Lifestyle, and bacterial taxonomy was compared against an in-house functional database developed based on the presence of genes encoding enzymes involved in specific biochemical pathways, including copiotroph, oligotroph, cellulolytic, ligninolytic, methanotroph, chitinolytic, assimilatory nitrite-reducing, dissimilatory-nitrite reducing, assimilatory nitrate-reducing, dissimilatory nitrate-reducing pathways (Vietorisz et al., 2024; Werbin et al., 2024). Fungal plant pathogens are assigned to genera identified by the FungalTraits database (Põlme et al., 2020) with any plant pathogenic capacity description, while fungal animal pathogens are assigned to genera identified by the FungalTraits database with an animal biotrophic capacity description. To assign pathogen status to bacterial ASVs, representative sequences are mapped to the Multiple Bacterial Pathogen Detection database (X. Yang et al., 2023) using the blastn algorithm and classified with 95% or greater sequence identity.
FILTER OUT LOW-READ SAMPLES
The total number of counts observed for a sample (i.e., read depth) has strong effects on community dissimilarity calculations: for example, samples with low numbers of reads often show high beta diversity, or dissimilarity in community composition from other samples (McMurdie & Holmes, 2014). This community dissimilarity may also be related to other properties of the sample (e.g., environmental condition from which the sample was collected), but it is impossible to confirm this if the sample sequenced poorly. Consequently, detection of potentially environmentally meaningful community differences between samples requires that we remove samples that have very low sequence (or read) counts after the quality control steps outlined above, then transform the data to “normalize” counts across samples by further reducing the effects of variable read depths (Gloor et al., 2017). Transformation and normalization is conducted after contaminating ASVs are removed.
In the first component of this process, we identify the effect of sequencing depth on beta diversity of microbial communities for individual amplicon datasets (e.g., 16S vs. ITS) and remove low-read samples that have a highly unique microbial community composition, primarily because of sequencing depth (or read number), rather than other properties of the sample. Unique community composition in low-read
samples is detected as an “outlier” in ordination plots of community dissimilarity between samples, using the raw ASV table (in phyloseq format) generated from the previous Formatting step in the protocol as input data. To identify outlier samples, first a community dissimilarity matrix is calculated. We use the Aitchison’s distance metric, which performs a log ratio transformation of the data and accounts for the compositional nature of amplicon sequence data (Gloor et al., 2017). The dissimilarity data is visualized
in a non-metric multidimensional scaling (NMDS) plot with points labelled as the sample ID. As low-read samples are removed, the NMDS plotting is repeated until all outlier samples have been removed from the NMDS plot. This creates a curated dataset that can be used to test for effects of other properties of the sample (e.g., environmental condition) that could explain variation in microbial community characteristics. Ideally, we will have removed problematic (i.e. low-read) samples while retaining as many samples as possible in the dataset.
The second component of this process is to evaluate your sample drop thresholds to determine whether beta diversity of microbial communities varies by expected properties of the sample, such as spatial distance between samples (Martiny et al., 2011; Talbot et al., 2014) or habitat from which samples are collected (Delgado-Baquerizo et al., 2018; Tedersoo et al., 2014), within the curated dataset. To run this test, a second set of NMDS is plotted, coloring samples by sample properties of interest (e.g., environmental conditions, such as habitat type). If the results of this test are not satisfactory, we repeat the first and second components of this step in the protocol with multiple sample read depth thresholds for each sample type, to see how they impact beta-diversity of the raw ASV counts, how many samples they would remove overall, and how many samples are removed from each environmental condition. Ideally, we choose a read depth threshold that will remove low-read count samples without majorly impacting data structure or removing too many samples from any one environmental condition.
REMOVE CONTAMINATING ASVs
Sample data can be contaminated with non-sample microorganisms at multiple points in the data collection and sequencing process (Jia et al., 2022), but computational approaches have recently been developed that can remove many of these contaminating sequences from the final microbiome dataset. We removed contaminating sequences from DNA amplicon sequence data with the decontam package in R (N. M. Davis et al., 2018). By default, contaminating ASVs are identified with the “prevalence” method, where an ASV’s prevalence in samples is statistically compared to prevalence in negative controls. ASVs that are identified as being more prevalent in negative controls than samples are labeled as contaminants and removed from the dataset. For any samples without a corresponding sequenced negative control, contaminating sequences are identified with the “frequency” method, where the frequency of an ASV is compared to the sample’s DNA concentration prior to pooling in a sequencing library. Contaminating sequences are assumed make up a larger fraction of DNA in samples that have little total DNA. Therefore, ASVs with a negative relationship between read count and sample DNA concentration will be labeled as contaminants and removed. These statistical methods allow for the removal of laboratory contaminants, rather than negative control contaminants that arise from cross-sample contamination. Additionally, any ASVs that are annotated to non-bacterial or archaeal taxa for 16S data or to non-fungal taxa for ITS data are removed from the dataset during this step.
OPTIONAL: BATCH CORRECT DATA
To check differences among samples due to batch (i.e., sequencing run) effects, the Aitchison distance matrix of untransformed data is calculated and a permutational multivaraiate analysis of variance (PERMANOVA) is performed with the the adonis2 function of the vegan package in R (Oksanen et al., 2015) is used to calculate the effect of a given variable or list of variables (i.e. sequencing run, sample type, etc.) on community dissimilarity between samples. The PERMANOVA test results of the given variables’ effect on community composition and an NMDS plot of the data, with sample points colored by the given variables, are output. Batch correction is then performed on the untransformed data and combined into one ASV table for downstream analysis. We use the ComBat_seq function in the sva package in R (Zhang et al., 2020), defining the batch variable (sample type, in the case of Atherton et al. 2025, as the leaf, soil, and root samples used different DNA extraction and PCR amplification methods and the sequencing batches did not have strong effects) and the environmental conditions to be preserved in the batch correction (tree age and site type, in the case of Atherton et al. 2025, as they were important variables in the study design). Batch correction is an optional step and does not need to be used in all downstream normalizations and transformations. For example, in Atherton et al. 2025, as batch correction was only done to account for differences in sample type for beta diversity analyses, not for differential abundance analyses.
NORMALIZE DATA
Untransformed counts of an ASV across samples can vary by methodological differences between samples that may obscure differences in community features (such as alpha-diversity, beta-diversity, and microbial group abundances) due to environmental conditions of interest (Gloor et al., 2017; McMurdie & Holmes, 2014). To “normalize” ASV counts so they are more comparable across samples and sample types, many different transformation processes can be used (Lin & Peddada, 2024). Our protocol generates three different types of data transformations, which can be useful in different situations: center log-ratio (CLR) transformation, Z-score transformation, and rarefaction. CLR transformation is often preferred in sequence-based microbiome analyses, as it accounts for the compositional nature of amplicon sequence-based microbiome datasets (Gloor et al., 2017; Greenacre et al., 2021). Therefore, our code outputs a CLR-transformed ASV table, as well as an Aitchison dissimilarity matrix (which performs a log ratio transformation) for pair-wise comparison of community differences across all samples. Z-score transformation can create datasets that follow a normal or gaussian distribution around a mean (Lloréns-Rico et al., 2021) and is one way to make datasets from different sample types (e.g., soil vs. leaves) comparable. Rarefaction randomly selects sequences to include in each sample, holding all samples to the same read depth. This can remove data to the point that it is unsuitable for calculation of differential taxon abundances across samples (McMurdie & Holmes, 2014). However, we have found that CLR does not sufficiently control for differences in sequencing depth across samples to calculate alpha diversity metrics. In addition, rarefaction can reduce the false discovery rate of ASVs when samples vary more than 10-fold in sequencing depth (Weiss et al., 2017), which is the case with most of our samples. As a result, we use rarefied data to calculate taxon and functional guild relative abundances, as well as alpha-diversity metrics. Rarefaction is conducted with the rarefy_even_depth function in the phyloseq package in R (McMurdie & Holmes, 2013). ASV counts are rarefied for each sample type using random subsampling based on a read count that minimizes dropped samples and maximizes the number of reads per sample. Rarefied data was then used downstream to calculate alpha diversity and determine the percent relative abundances of microbial functional guilds in each sample.
To perform downstream beta diversity analyses, the Aitchison distance matrices of each data table are calculated. A pseudocount of “1” is added to all values prior to the calculation (Gloor et al., 2017), as this transformation cannot be performed until the zeros are adjusted, due to the use of centered log-ratio transformations in the calculation.
CALCULATE DIVERSITY METRICS AND FUNCTIONAL GUILD PERCENT RELATIVE ABUNDANCES
Using rarefied data, Shannon’s alpha diversity for each amplicon community is computed (Weiss et al., 2017) using the vegan package in R (Oksanen et al., 2015).
Percent relative abundances of functional guilds in each sample is also calculated using rarefied data (Tatsumi et al., 2023). First, rarefied ASV count data are converted to percent relative abundances by dividing each ASV count by the total reads per sample. This ratio transformation allows us to fully convert data to proportions, accounts for compositionality, and makes comparisons of microbial group relative abundances between samples relatively straightforward, especially studies where different sample types are rarefied to different read counts, as was the case in Atherton et al. 2025. To calculate the percent of the microbial community represented by a functional guild, the ratio-transformed rarefied counts are then summed for ASVs assigned to each functional guild.
Protocol references
Anthony, M. A., Stinson, K. A., Moore, J. A. M., & Frey, S. D. (2020). Plant invasion impacts on fungal community structure and function depend on soil warming and nitrogen enrichment. Oecologia, 194(4), 659–672. https://doi.org/10.1007/s00442-020-04797-4
Auguie, B., & Antonov, A. (2017). gridExtra: Miscellaneous Functions for “Grid” Graphics (Version 2.3) [Computer software]. https://cran.r-project.org/web/packages/gridExtra/index.html
Bolyen, E., Rideout, J. R., Dillon, M. R., Bokulich, N. A., Abnet, C. C., Al-Ghalith, G. A., Alexander, H., Alm, E. J., Arumugam, M., Asnicar, F., Bai, Y., Bisanz, J. E., Bittinger, K., Brejnrod, A., Brislawn, C. J., Brown, C. T., Callahan, B. J., Caraballo-Rodríguez, A. M., Chase, J., … Caporaso, J. G. (2019). Reproducible, interactive, scalable and extensible microbiome data science using QIIME 2. Nature Biotechnology, 37(8), 852–857. https://doi.org/10.1038/s41587-019-0209-9
Boogaart, K. G. van den, Tolosana-Delgado, R., & Bren, M. (2024). compositions: Compositional Data Analysis (Version 2.0-8) [Computer software]. https://cran.r-project.org/web/packages/compositions/index.html
Callahan, B. J., McMurdie, P. J., Rosen, M. J., Han, A. W., Johnson, A. J. A., & Holmes, S. P. (2016). DADA2: High-resolution sample inference from Illumina amplicon data. Nature Methods, 13(7), 581–583. https://doi.org/10.1038/nmeth.3869
Caporaso, J. G., Ackermann, G., Apprill, A., Bauer, M., Berg-Lyons, D., Betley, J., Fierer, N., Fraser, L., Fuhrman, J. A., Gilbert, J. A., Gormley, N., Humphrey, G., Huntley, J., Jansson, J. K., Knight, R., Lauber, C. L., Lozupone, C. A., McNally, S., Needham, D. M., … Weber, L. (2023). EMP 16S Illumina Amplicon Protocol. https://www.protocols.io/view/emp-16s-illumina-amplicon-protocol-cpisvkee
Caporaso, J. G., Lauber, C. L., Walters, W. A., Berg-Lyons, D., Lozupone, C. A., Turnbaugh, P. J., Fierer, N. G., & Knight, R. (2011). Global patterns of 16S rRNA diversity at a depth of millions of sequences per sample. Proceedings of the National Academy of Sciences of the United States of America, 108(SUPPL. 1), 4516–4522. https://doi.org/10.1073/pnas.1000080107
Davis, N. M., Proctor, D. M., Holmes, S. P., Relman, D. A., & Callahan, B. J. (2018). Simple statistical identification and removal of contaminant sequences in marker-gene and metagenomics data. Microbiome, 6(1), 226. https://doi.org/10.1186/s40168-018-0605-2
Davis, T. L., package.), A. D. (Some documentation and examples ported from the getopt, module.), P. S. F. (Some documentation from the optparse P., Lianoglou, S., Nikelski, J., Müller, K., Humburg, P., FitzJohn, R., & Choi, G. J. (2024). optparse: Command Line Option Parser (Version 1.7.5) [Computer software]. https://cran.r-project.org/web/packages/optparse/index.html
Delgado-Baquerizo, M., Oliverio, A. M., Brewer, T. E., Benavent-gonzález, A., Eldridge, D. J., Bardgett, R. D., Maestre, F. T., Singh, B. K., & Fierer, N. G. (2018). A global atlas of the dominant bacteria found in soil. Science, 325(February), 320–325.
Fadrosh, D. W., Ma, B., Gajer, P., Sengamalay, N., Ott, S., Brotman, R. M., & Ravel, J. (2014). An improved dual-indexing approach for multiplexed 16S rRNA gene sequencing on the Illumina MiSeq platform. Microbiome, 2(1), 6. https://doi.org/10.1186/2049-2618-2-6
Gloor, G. B., Macklaim, J. M., Pawlowsky-Glahn, V., & Egozcue, J. J. (2017). Microbiome Datasets Are Compositional: And This Is Not Optional. Frontiers in Microbiology, 8. https://www.frontiersin.org/articles/10.3389/fmicb.2017.02224
Greenacre, M., Martínez-Álvaro, M., & Blasco, A. (2021). Compositional Data Analysis of Microbiome and Any-Omics Datasets: A Validation of the Additive Logratio Transformation. Frontiers in Microbiology, 12. https://doi.org/10.3389/fmicb.2021.727398
Hester, J., Wickham, H., Bryan, J., Bearrows, S., library), https://github com/mandreyel/ (mio, implementation), J. J. (grisu3, implementation), M. J. (grisu3, Software, P., & PBC. (2023). vroom: Read and Write Rectangular Text Data Quickly (Version 1.6.5) [Computer software]. https://cran.r-project.org/web/packages/vroom/index.html
Jia, Y., Zhao, S., Guo, W., Peng, L., Zhao, F., Wang, L., Fan, G., Zhu, Y., Xu, D., Liu, G., Wang, R., Fang, X., Zhang, H., Kristiansen, K., Zhang, W., & Chen, J. (2022). Sequencing introduced false positive rare taxa lead to biased microbial community diversity, assembly, and interaction interpretation in amplicon studies. Environmental Microbiome, 17(1), 43. https://doi.org/10.1186/s40793-022-00436-y
Leek, J. T., Johnson, W. E., Parker, H. S., Fertig, E. J., Jaffe, A. E., Zhang, Y., Storey, J. D., & Torres. (2025). sva: Surrogate Variable Analysis (Version 3.48.0) [Computer software]. http://bioconductor.org/packages/sva/
Lin, H., & Peddada, S. D. (2024). Multigroup analysis of compositions of microbiomes with covariate adjustments and repeated measures. Nature Methods, 21(1), 83–91. https://doi.org/10.1038/s41592-023-02092-7
Liu, Z., Lozupone, C., Hamady, M., Bushman, F. D., & Knight, R. (2007). Short pyrosequencing reads suffice for accurate microbial community analysis. Nucleic Acids Research, 35(18), e120. https://doi.org/10.1093/nar/gkm541
Lloréns-Rico, V., Vieira-Silva, S., Gonçalves, P. J., Falony, G., & Raes, J. (2021). Benchmarking microbiome transformations favors experimental quantitative approaches to address compositionality and sampling depth biases. Nature Communications, 12(1), 3562. https://doi.org/10.1038/s41467-021-23821-6
Martin, M. (2011). Cutadapt removes adapter sequences from high-throughput sequencing reads. EMBnet.Journal, 17(1), Article 1. https://doi.org/10.14806/ej.17.1.200
Martiny, J. B. H., Eisen, J. A., Penn, K., Allison, S. D., & Horner-Devine, M. C. (2011). Drivers of bacterial β-diversity depend on spatial scale. Proceedings of the National Academy of Sciences, 108(19), 7850–7854. https://doi.org/10.1073/pnas.1016308108
McMurdie, P. J., & Holmes, S. (2013). phyloseq: An R Package for Reproducible Interactive Analysis and Graphics of Microbiome Census Data. PLOS ONE, 8(4), e61217. https://doi.org/10.1371/journal.pone.0061217
McMurdie, P. J., & Holmes, S. (2014). Waste Not, Want Not: Why Rarefying Microbiome Data Is Inadmissible. PLOS Computational Biology, 10(4), e1003531. https://doi.org/10.1371/journal.pcbi.1003531
Nilsson, R. H., Larsson, K.-H., Taylor, A. F. S., Bengtsson-Palme, J., Jeppesen, T. S., Schigel, D., Kennedy, P. G., Picard, K., Glöckner, F. O., Tedersoo, L., Saar, I., Kõljalg, U., & Abarenkov, K. (2019). The UNITE database for molecular identification of fungi: Handling dark taxa and parallel taxonomic classifications. Nucleic Acids Research, 47(D1), D259–D264. https://doi.org/10.1093/nar/gky1022
Oksanen, A. J., Blanchet, F. G., Kindt, R., Legendre, P., Minchin, P. R., Hara, R. B. O., Simpson, G. L., Solymos, P., Stevens, M. H. H., & Wagner, H. (2015). Package “vegan.” In CRAN [Computer
software].
Põlme, S., Abarenkov, K., Henrik Nilsson, R., Lindahl, B. D., Clemmensen, K. E., Kauserud, H., Nguyen, N., Kjøller, R., Bates, S. T., Baldrian, P., Frøslev, T. G., Adojaan, K., Vizzini, A., Suija, A., Pfister, D., Baral, H.-O., Järv, H., Madrid, H., Nordén, J., … Tedersoo, L. (2020). FungalTraits: A user-friendly traits database of fungi and fungus-like stramenopiles. Fungal Diversity, 105(1), 1–16. https://doi.org/10.1007/s13225-020-00466-2
Qin, C., Bartelme, R., Chung, Y. A., Fairbanks, D., Lin, Y., Liptzin, D., Muscarella, C., Naithani, K., Peay, K., Pellitier, P., St. Rose, A., Stanish, L., Werbin, Z., & Zhu, K. (2021). From DNA sequences to microbial ecology: Wrangling NEON soil microbe data with the neonMicrobe R package. Ecosphere, 12(11), e03842. https://doi.org/10.1002/ecs2.3842
Quast, C., Pruesse, E., Yilmaz, P., Gerken, J., Schweer, T., Yarza, P., Peplies, J., & Glöckner, F. O. (2013). The SILVA ribosomal RNA gene database project: Improved data processing and web-based tools. Nucleic Acids Research, 41(D1), D590–D596. https://doi.org/10.1093/nar/gks1219
R Core Team. (2013). R: A language and environment for statistical computing. R Foundation for Statistical Computing (Version 4.3.1) [Computer software]. http://www.R-project.org/
Rognes, T., Flouri, T., Nichols, B., Quince, C., & Mahé, F. (2016). VSEARCH: A versatile open source tool for metagenomics. PeerJ, 4, e2584. https://doi.org/10.7717/peerj.2584
Silverstein, M. R., Bhatnagar, J. M., & Segrè, D. (2024). Metabolic complexity drives divergence in microbial communities. Nature Ecology & Evolution, 8(8), 1493–1504. https://doi.org/10.1038/s41559-024-02440-6
Sogin, M. L., Morrison, H. G., Huber, J. A., Welch, D. M., Huse, S. M., Neal, P. R., Arrieta, J. M., & Herndl, G. J. (2006). Microbial diversity in the deep sea and the underexplored “rare biosphere.” Proceedings of the National Academy of Sciences, 103(32), 12115–12120. https://doi.org/10.1073/pnas.0605127103
Talbot, J. M., Bruns, T. D., Taylor, J. W., Smith, D. P., Branco, S., Glassman, S. I., Erlandson, S., Vilgalys, R., Liao, H. L., Smith, M. E., & Peay, K. G. (2014). Endemism and functional convergence across the North American soil mycobiome. Proceedings of the National Academy of Sciences of the United States of America, 111(17), 6341–6346. https://doi.org/10.1073/pnas.1402584111
Tatsumi, C., Atherton, K. F., Garvey, S. M., Conrad-Rooney, E., Morreale, L. L., Hutyra, L. R., Templer, P. H., & Bhatnagar, J. M. (2023). Urbanization and edge effects interact to drive mutualism breakdown and the rise of unstable pathogenic communities in forest soil. Proceedings of the National Academy of Sciences, 120(36), e2307519120. https://doi.org/10.1073/pnas.2307519120
Tedersoo, L., Bahram, M., Põlme, S., Kõljalg, U., Yorou, N. S., Wijesundera, R., Ruiz, L. V., Vasco-Palacios, A. M., Thu, P. Q., Suija, A., Smith, M. E., Sharp, C., Saluveer, E., Saitta, A., Rosas, M., Riit, T., Ratkowsky, D., Pritsch, K., Põldmaa, K., … Abarenkov, K. (2014). Global diversity and geography of soil fungi. Science, 346(6213), 1256688. https://doi.org/10.1126/science.1256688
Templ, M., Hron, K., Filzmoser, P., Facevicova, K., Kynclova, P., Walach, J., Pintar, V., Chen, J., Miksova, D., Meindl, B., Menafoglio, A., Blasi, A. D., Pavone, F., Stefelova, N., Zeni, G., & Wiederkehr, R. (2023). robCompositions: Compositional Data Analysis (Version 2.4.1) [Computer software]. https://cran.r-project.org/web/packages/robCompositions/index.html
Thompson, L. R., Sanders, J. G., McDonald, D., Amir, A., Ladau, J., Locey, K. J., Prill, R. J., Tripathi, A., Gibbons, S. M., Ackermann, G., Navas-Molina, J. A., Janssen, S., Kopylova, E., Vázquez-Baeza,
Y., González, A., Morton, J. T., Mirarab, S., Xu, Z. Z., Jiang, L., … Zhao, H. (2017). A communal catalogue reveals Earth’s multiscale microbial diversity. Nature, 551(7681), 457–463. https://doi.org/10.1038/nature24621
Vasar, M., Davison, J., Sepp, S.-K., Mucina, L., Oja, J., Al-Quraishy, S., Anslan, S., Bahram, M., Bueno, C. G., Cantero, J. J., Decocq, G., Fraser, L., Hiiesalu, I., Hozzein, W. N., Koorem, K., Meng, Y., Moora, M., Onipchenko, V., Öpik, M., … Zobel, M. (2022). Global soil microbiomes: A new frontline of biome-ecology research. Global Ecology and Biogeography, 31(6), 1120–1132. https://doi.org/10.1111/geb.13487
Vietorisz, C., Policelli, N., Li, A., Adams, L. A., & Bhatnagar, J. M. (2024). Microbial functional guilds and genes are key to explaining soil nutrient cycling alongside soil and plant variables (p.
2024.12.13.627780). bioRxiv. https://doi.org/10.1101/2024.12.13.627780
Weiss, S., Xu, Z. Z., Peddada, S., Amir, A., Bittinger, K., Gonzalez, A., Lozupone, C., Zaneveld, J. R., Vázquez-Baeza, Y., Birmingham, A., Hyde, E. R., & Knight, R. (2017). Normalization and microbial differential abundance strategies depend upon data characteristics. Microbiome, 5(1), 27. https://doi.org/10.1186/s40168-017-0237-y
Werbin, Z., Averill, C., Bhatnagar, J., & Dietze, M. (2024). Forecasting the soil microbiome at a continental scale. Research Square. https://doi.org/10.21203/rs.3.rs-5183308/v1
Wickham, H., Bryan, J., Posit, attribution), P. (Copyright holder of all R. code and all C. code without explicit copyright, code), M. K. (Author of included R., code), K. V. (Author of included libxls, code), C. L. (Author of included libxls, code), B. C. (Author of included libxls, code), D. H. (Author of included libxls, & code), E. M. (Author of included libxls. (2025). readxl: Read Excel Files (Version 1.4.5) [Computer software]. https://cran.r-project.org/web/packages/readxl/index.html
Wickham, H., Chang, W., Henry, L., Pedersen, T. L., Takahashi, K., Wilke, C., Woo, K., Yutani, H., Dunnington, D., Brand, T. van den, Posit, & PBC. (2025). ggplot2: Create Elegant Data Visualisations Using the Grammar of Graphics (Version 3.5.2) [Computer software]. https://cran.r-project.org/web/packages/ggplot2/index.html
Wickham, H., François, R., Henry, L., Müller, K., Vaughan, D., Software, P., & PBC. (2023). dplyr: A Grammar of Data Manipulation (Version 1.1.4) [Computer software]. https://cran.r-project.org/web/packages/dplyr/index.html
Wickham, H., Henry, L., Software, P., PBC [cph, & fnd. (2025). purrr: Functional Programming Tools (Version 1.1.0) [Computer software]. https://cran.r-project.org/web/packages/purrr/index.html
Wickham, H., Hester, J., Francois, R., Bryan, J., Bearrows, S., Software, P., PBC, library), https://github com/mandreyel/ (mio, implementation), J. J. (grisu3, & implementation), M. J. (grisu3. (2024). readr: Read Rectangular Text Data (Version 2.1.5) [Computer software]. https://cran.r-project.org/web/packages/readr/index.html
Wickham, H., & RStudio. (2023). tidyverse: Easily Install and Load the “Tidyverse” (Version 2.0.0) [Computer software]. https://cran.r-project.org/web/packages/tidyverse/index.html
Wickham, H., Vaughan, D., Girlich, M., Ushey, K., Software, P., & PBC. (2024). tidyr: Tidy Messy Data (Version 1.3.1) [Computer software]. https://cran.r-project.org/web/packages/tidyr/index.html
Yang, R.-H., Su, J.-H., Shang, J.-J., Wu, Y.-Y., Li, Y., Bao, D.-P., & Yao, Y.-J. (2018). Evaluation of the ribosomal DNA internal transcribed spacer (ITS), specifically ITS1 and ITS2, for the analysis of fungal diversity by deep sequencing. PLoS ONE, 13(10), e0206428. https://doi.org/10.1371/journal.pone.0206428
Yang, X., Jiang, G., Zhang, Y., Wang, N., Zhang, Y., Wang, X., Zhao, F.-J., Xu, Y., Shen, Q., & Wei, Z. (2023). MBPD: A multiple bacterial pathogen detection pipeline for One Health practices. iMeta, 2(1), e82. https://doi.org/10.1002/imt2.82
Zhang, Y., Parmigiani, G., & Johnson, W. E. (2020). ComBat-seq: Batch effect adjustment for RNA-seq count data. NAR Genomics and Bioinformatics, 2(3), lqaa078. https://doi.org/10.1093/nargab/lqaa078
Zhao, J., Rodriguez, J., & Martens-Habbena, W. (2023). Fine-scale evaluation of two standard 16S rRNA gene amplicon primer pairs for analysis of total prokaryotes and archaeal nitrifiers in differently managed soils. Frontiers in Microbiology, 14. https://doi.org/10.3389/fmicb.2023.1140487