Sep 19, 2023
A computational pipeline to quantify perinuclear lysosomes in fibroblasts using CellProfiler
- Ebsy Jaimon1,2,
- Suzanne Pfeffer1,2
- 1Stanford University School of Medicine;
- 2Aligning Science Across Parkinson’s (ASAP) Collaborative Research Network


Protocol Citation: Ebsy Jaimon, Suzanne Pfeffer 2023. A computational pipeline to quantify perinuclear lysosomes in fibroblasts using CellProfiler. protocols.io https://dx.doi.org/10.17504/protocols.io.81wgbxrw3lpk/v1
License: This is an open access protocol distributed under the terms of the Creative Commons Attribution License, which permits unrestricted use, distribution, and reproduction in any medium, provided the original author and source are credited
Protocol status: Working
We use this protocol and it's working
Created: September 18, 2023
Last Modified: May 31, 2024
Protocol Integer ID: 87957
Keywords: ASAPCRN, perinuclear lysosomes in fibroblast, perinuclear lysosome, distribution of lysosome, lysosome, cellprofiler software pipeline, mef cell, using cellprofiler, cell, scanning confocal microscope, fibroblast, confocal microscope
Funders Acknowledgements:
Aligning Science Across Parkinson's Disease
Grant ID: ASAP-000463
Abstract
Here we present a CellProfiler software pipeline to quantify the distribution of lysosomes in MEF cells. The lysosomes were stained using anti-LAMP1 antibody, and nuclei were labeled using DAPI. The images were acquired using a Zeiss laser scanning confocal microscope and were maximum intensity projected in FIJI.
Image Attribution
We thank Dr. Wondwossen Yeshaw for providing images for this analysis.
Materials
Latest edition CellProfiler 4.04 (or later)
Maximum intensity projected raw .TIF files
Import files into CellProfiler and extract metadata
A. Select the Images module, drag and drop the maximum intensity projected .TIF files as indicated
B. Select the Metadata module
In the Metadata module:
Extract metadata? Yes.
Metadata extraction method: Extract from file/folder names
Metadata source: File name
Regular expression to extract from file name :
“Regex” will be as follows:
^(?P<celltype>[a-z]{2})MEFs_(?P<treatment>[A-Z]{4})-(?P<position>[0-9]{2})
for an example file name “wtMEFs_DMSO-01.czi_max.tif”. This step helps to
extract the cell type, treatment, and position from each file name.
In Regex,
^ indicates the beginning of the file name
(?P<celltype>[a-z]{2}) tells the program to name the
captured field “celltype” and recognize two letters that follow
(?P<treatment>[A-Z]{4}) tells the program to name the
captured field “treatment” and recognize four letters that follow
(?P<position>[0-9]{2}) tells the program to name the
captured field “position” and recognize two digits that follow
Extract metadata from: All images
Add another extraction method
Metadata extraction method: Extract from image file headers
Extract metadata from: All images
Hit “Extract metadata”
Metadata data type: Text
Hit “update” to populate the metadata field
Group individual channels and create image subsets
A. Go to NamesAndTypes module
Assign a name to : “Images matching rules”
Process as 3D : No
Select the rule criteria
Match “All” of the following rules
“Metadata/Does/Have C matching 0”
Name to assign these images: LAMP1
Select the image type: Grayscale image
Set intensity range from : Image metadata
Add another image
Match “All” of the following rules
“Metadata/Does/Have C matching 1”
Name to assign these images: DAPI
Select the image type: Grayscale image
Set intensity range from : Image metadata
Hit “update” to populate the names and types field
B. Select Groups module
Do you want to group your images? Yes
Metadata category: celltype
Add another metadata item
Metadata category: treatment
Add another metadata item
Metadata category: position
This groups images based on cell type, treatment, and position as identified in the metadata module.
Identify lysosomes as objects
Click on the “+” sign at the bottom next to Adjust Modules. One can choose different modules by double-clicking from the list or by typing in the search box. Under the module category, object processing, Add Identifyprimaryobjects module
Use advanced settings? Yes
Select the input image: LAMP1
Name the primary objects to be identified: LAMP1objects
Typical diameter of objects, in pixel units: 3 - 100
Discard objects outside the diameter range? Yes
Discard objects touching the border of the image? Yes
Threshold strategy? Global
Thresholding method? Otsu
Two-class or three-class thresholding? Two classes
Threshold smoothing scale 1.3488
Threshold correction factor 1.0
Lower and upper bounds on threshold 0.25 and 1.0
Log transform before thresholding? Yes
Method to distinguish clumped objects? Intensity
Method to draw dividing lines between clumped objects? Intensity
Automatically calculate size of smoothing filter for declumping? Yes
Automatically calculate size for smoothing filter for declumping? Yes
Automatically calculate minimum allowed distance between local maxima? Yes
Speed up by using lower-resolution image to find local maxima? Yes
Display accepted local maxima? No
Fill holes in identified objects? After both thresholding and declumping
Handling of objects if excessive number of objects identified? Continue
Note
Note : These parameters will need to be optimized for each image set. Check by clicking“Start Test Mode” and hitting the green triangle next to the IdentifyPrimaryObjects module each time a parameter is changed to find the best parameters for each image set. Green outlines represent valid objects whereas yellow and red represent invalid objects, as they are either touching the border or outside the diameter range set.
Figure 1: Lysosomes in MEF cells stained using anti-LAMP1 (left) and the LAMP1 objects identified by CellProfiler (right). Green regions represent valid objects.
Segment nuclei
Add Identifyprimaryobjects module
Use advanced settings? Yes
Select the input image: DAPI
Name the primary objects to be identified: Nuclei
Typical diameter of objects, in pixel units: 110 - 500
Discard objects outside the diameter range? Yes
Discard objects touching the border of the image? Yes
Threshold strategy? Global
Thresholding method? Minimum Cross-Entropy
Threshold smoothing scale 1.3488
Threshold correction factor 1.0
Lower and upper bounds on threshold 0.1 and 1.0
Log transform before thresholding? No
Method to distinguish clumped objects? Intensity
Method to draw dividing lines between clumped objects? Intensity
Automatically calculate size of smoothing filter for declumping? Yes
Automatically calculate size for smoothing filter for declumping? Yes
Automatically calculate minimum allowed distance between local maxima? Yes
Speed up by using lower-resolution image to find local maxima? Yes
Display accepted local maxima? No
Fill holes in identified objects? After both thresholding and declumping
Handling of objects if excessive number of objects identified? Continue
Note
Note: Check by clicking “Start Test Mode” and hitting the green triangle next to the IdentifyPrimaryObjects module each time a parameter is changed to find the best parameters for each image set.
Figure 2: Nuclei in MEF cells labeled using DAPI (left) and the nuclei objects identified by CellProfiler (right). Green outlines represent valid objects.
Define the perinuclear region
A. Add ExpandOrShrinkObjects module from the “+” sign at the bottom
Select the input objects : Nuclei
Name the output objects: Expandednuclei
Select the operation: Expand objects by a specified number of pixels
Number of pixels by which to expand or shrink : 20
This expands the nuclei by 20 pixels and this ring can be used to define perinuclear region.
Note
In this case, we used 20 pixels. However, larger cells may require a larger number of pixels to capture the perinuclear region adequately.
B. Add OverlayOutlines module
Display outlines on a blank image: No
Select image on which to display outlines: LAMP1
Name the output image: outline20pixels
Outline display mode: Color
How to outline: Thick
Select objects to display: Expandednuclei
Select outline color: Maraschino
C. Add SaveImages module
Select type of image to save: Image
Select the image to save: outline20pixels
Constructing file names: From image filename
Image name for file prefix: LAMP1
Append a suffix to the image file name? Yes
Text to append to the image name: outline20pixels
Saved file format: tiff
Image bit depth: 8-bit integer
Save with lossless compression? Yes
Output file location: choose a folder where images should be saved
Overwrite existing files without warning? No
When to save? Every cycle
Record the file and path information to the saved image? No
Create subfolders in the output folder? No
Note
Steps B and C allow you to save and verify CellProfiler’s interpretations for each image.
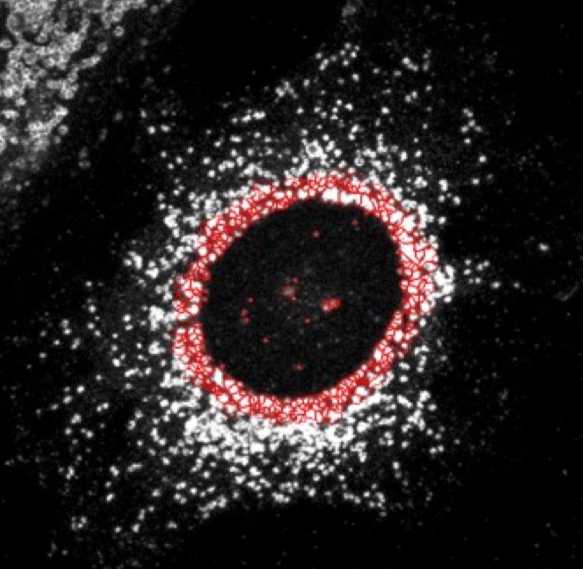
Figure 3: The red outline indicates the region within 20 pixels of the nucleus.
Segment lysosome objects in the perinuclear region
A. Add RelateObjects module to relate parent objects
(“nuclei expanded by 20 pixels”) with child objects (“LAMP1 objects”). Parent objects are the objects that encompass the child objects and child objects will be contained within the parent object.
Parent objects: Expandednuclei
Child objects: LAMP1objects
Calculate per-parent means for all child measurements? No
Calculate child-parent distances? None
Do you want to save the children with parents as a new object set? Yes
Name the output object : Relate objects_perinuclearLAMP1
B. Add OverlayOutlines module
Display outlines on a blank image: No
Select image on which to display outlines: LAMP1
Name the output image: PerinuclearLAMP1
Outline display mode: Color
How to outline: Outer
Select objects to display: Relate objects_perinuclearLAMP1
Select outline color: Maraschino
C. Add SaveImages module
Select type of image to save: image
Select the image to save: PerinuclearLAMP1
Constructing file names: From image filename
Image name for file prefix: LAMP1
Append a suffix to the image file name? Yes
Text to append to the image name: PerinuclearLAMP1
Saved file format: tiff
Image bit depth: 8-bit integer
Save with lossless compression? Yes
Output file location: choose a folder where images should be saved
Overwrite existing files without warning? No
When to save? Every cycle
Record the file and path information to the saved image? No
Create subfolders in the output folder? No
Note
Steps B and C allow you to save and verify CellProfiler’s interpretations for each image.
Figure 4: The objects outlined in red indicate the LAMP1 objects in the perinuclear region.
Identify cell boundaries
A. Add IdentifySecondaryObjects module to identify the whole cell using the nucleus as the primary object.
Select the input image: LAMP1
Select the input objects: Nuclei
Name the objects to be identified: wholecells
Select the method to identify the secondary objects: Propagation
This module finds the dividing lines between secondary objects that are touching.
Threshold strategy: Global.
Thresholding method: Minimum Cross-Entropy
Threshold smoothing scale: 1.3488
Threshold correction factor: 1.0
Lower and upper bounds of threshold: 0.048-1.0
These numbers may need to be changed per experiment depending on the quality of staining, background noise etc.
Log transform before thresholding? No
Regularization factor: 0.01
Fill holes in identified objects? Yes
Discard secondary objects touching the border of the image? No
B. Add OverlayOutlines module
Display outlines on a blank image: No
Select image on which to display outlines: LAMP1
Name the output image: Cell outline
Outline display mode: Color
How to outline: Thick
Select objects to display: wholecells
Select outline color: Maraschino
C. Add SaveImages module
Select type of image to save: image
Select the image to save: Celloutline
Constructing file names: From image filename
Image name for file prefix: LAMP1
Append a suffix to the image file name? Yes
Text to append to the image name: Celloutline
Saved file format: tiff
Image bit depth: 8-bit integer
Save with lossless compression? Yes
Output file location: choose a folder where images should be saved
Overwrite existing files without warning? No
When to save? Every cycle
Record the file and path information to the saved image? No
Create subfolders in the output folder? No
Segment lysosome objects in the non-perinuclear region
A. Add MaskObjects module
Select objects to be masked: LAMP1objects
Name the masked objects: NonperinuclearLAMP1
Mask using a region defined by other objects or by binary image : Objects
Select the masking object: RelateObjects_perinuclear LAMP1
Invert the mask: Yes
Handling of objects that are partially masked: Keep overlapping region
Numbering of resulting objects: Renumber
This step masks the LAMP1 objects in the perinuclear region.
B. Add RelateObjects module
Parent objects: wholecells
Child objects: NonperinuclearLAMP1
Calculate per-parent means for all child measurements? No
Calculate child-parent distances? None
Do you want to save the children with parents as a new object set? Yes
Name the output object : RelateObjects_nonperinuclearLAMP1
This step segments the LAMP1 objects in the non-perinuclear region.
C. Add OverlayOutlines module
Display outlines on a blank image: No
Select image on which to display outlines: LAMP1
Name the output image: NonperinuclearLAMP1
Outline display mode: Color
How to outline: Outer
Select objects to display: RelateObjects_nonperinuclear LAMP1
Select outline color: Maraschino
D. Add SaveImages module:
Select type of image to save: Image
Select the image to save: NonperinuclearLAMP1
Constructing file names: From image filename
Image name for file prefix: LAMP1
Append a suffix to the image file name? Yes
Text to append to the image name: NonperinuclearLAMP1
Saved file format: tiff
Image bit depth: 8-bit integer
Save with lossless compression? Yes
Output file location: choose a folder where images should be saved
Overwrite existing files without warning? No
When to save? Every cycle
Record the file and path information to the saved image? No
Create subfolders in the output folder? No
Note
Steps C and D allow you to save and verify CellProfiler’s interpretations for each image.
Figure 6. The objects outlined in red color show the non-perinuclear LAMP1 objects identified by CellProfiler.
Measure the integrated intensity of LAMP1
Add MeasureObjectIntensity module
Select images to measure: LAMP1
Select objects to measure: RelateObjects_PerinuclearLAMP1, RelateObjects_nonperinuclear LAMP1
Export the data
Add ExportToSpreadsheet module from the + at the bottom
Select the column delimiter: Tab
Output file location: choose a folder where you want the images to be saved.
Add a prefix to file names? Yes.
File name prefix: Add experiment identifier.
Overwrite existing files without warning? No
Note: While the pipeline is run for optimizing the parameters, choose Yes to avoid being asked to rewrite each file.
Add image metadata columns to your object data file? Yes
Add image file and folder names to your object data file? Yes
Representation of Nan/Inf: NaN
Select measurements to export? Yes
Press button to select measurements:
Under “Expandednuclei” select: Number
Under “RelateObjects_PerinuclearLAMP1” choose Intensity and then integrated intensity.
Under “RelateObjects_nonperinuclearLAMP1” choose Intensity and then Integrated intensity
Calculate the per-image mean values for object measurements? No
Calculate the per-image median values for object measurements? No
Calculate the per-image standard deviation values for object measurements? No
Create GenePattern GCT file? No
Export all measurement types? No
Export all measurement types? No
Save the pipeline from File-Save Project and hit Analyze Images on bottom left.
The pipeline will run and export the data to the folder previously specified.
The output file can be opened in Excel software. Distinct columns indicate the number of nuclei in each image and the integrated intensity of individual objects – perinuclear and non-perinuclear.